- Research: Driving Progress Against Cancer
- Cancer: An Ongoing Challenge
- Inequities in the Burden of Cancer in the United States
- Variable Progress Against Different Types of Cancer and Stages of Diagnosis
- The Growing Population Burden of Cancer
- The Global Burden of Cancer
- Funding Cancer Research: A Vital Investment
Cancer in 2026
In this section, you will learn:
- In the United States (US), the overall cancer death rate declined by 35 percent between 1991 and 2024, translating into more than 4.8 million cancer deaths averted.
- The decline in the overall US cancer death rate is largely attributable to reductions in smoking, as well as improvements in early detection and treatment for certain cancers.
- Approximately 18.6 million cancer survivors were living in the United States as of January 1, 2025.
- Substantial inequities in the burden of cancer persist across many segments of the US population and are largely driven by structural and social factors.
- The economic burden of cancer on individuals and the US health care system is projected to increase in the coming decades, underscoring the need for sustained research investment and stronger federal support for medical science and public health.
- Continued progress against cancer will require collaboration among all stakeholders to drive scientific discovery and ensure that advances across the cancer continuum translate into improved outcomes for all populations.
Contents
Research: Driving Progress Against Cancer
Research is the cornerstone of progress against the collection of diseases we call cancer. It fuels basic science discoveries, accelerates clinical breakthroughs, and informs public policies designed to improve health outcomes, ultimately saving lives and enhancing quality of life. Advances across basic, clinical, translational, and population sciences, along with technological innovations such as artificial intelligence and machine learning (see Envisioning the Future of Cancer Research), are fueling new strategies for cancer prevention, early detection, diagnosis, treatment, and survivorship care.
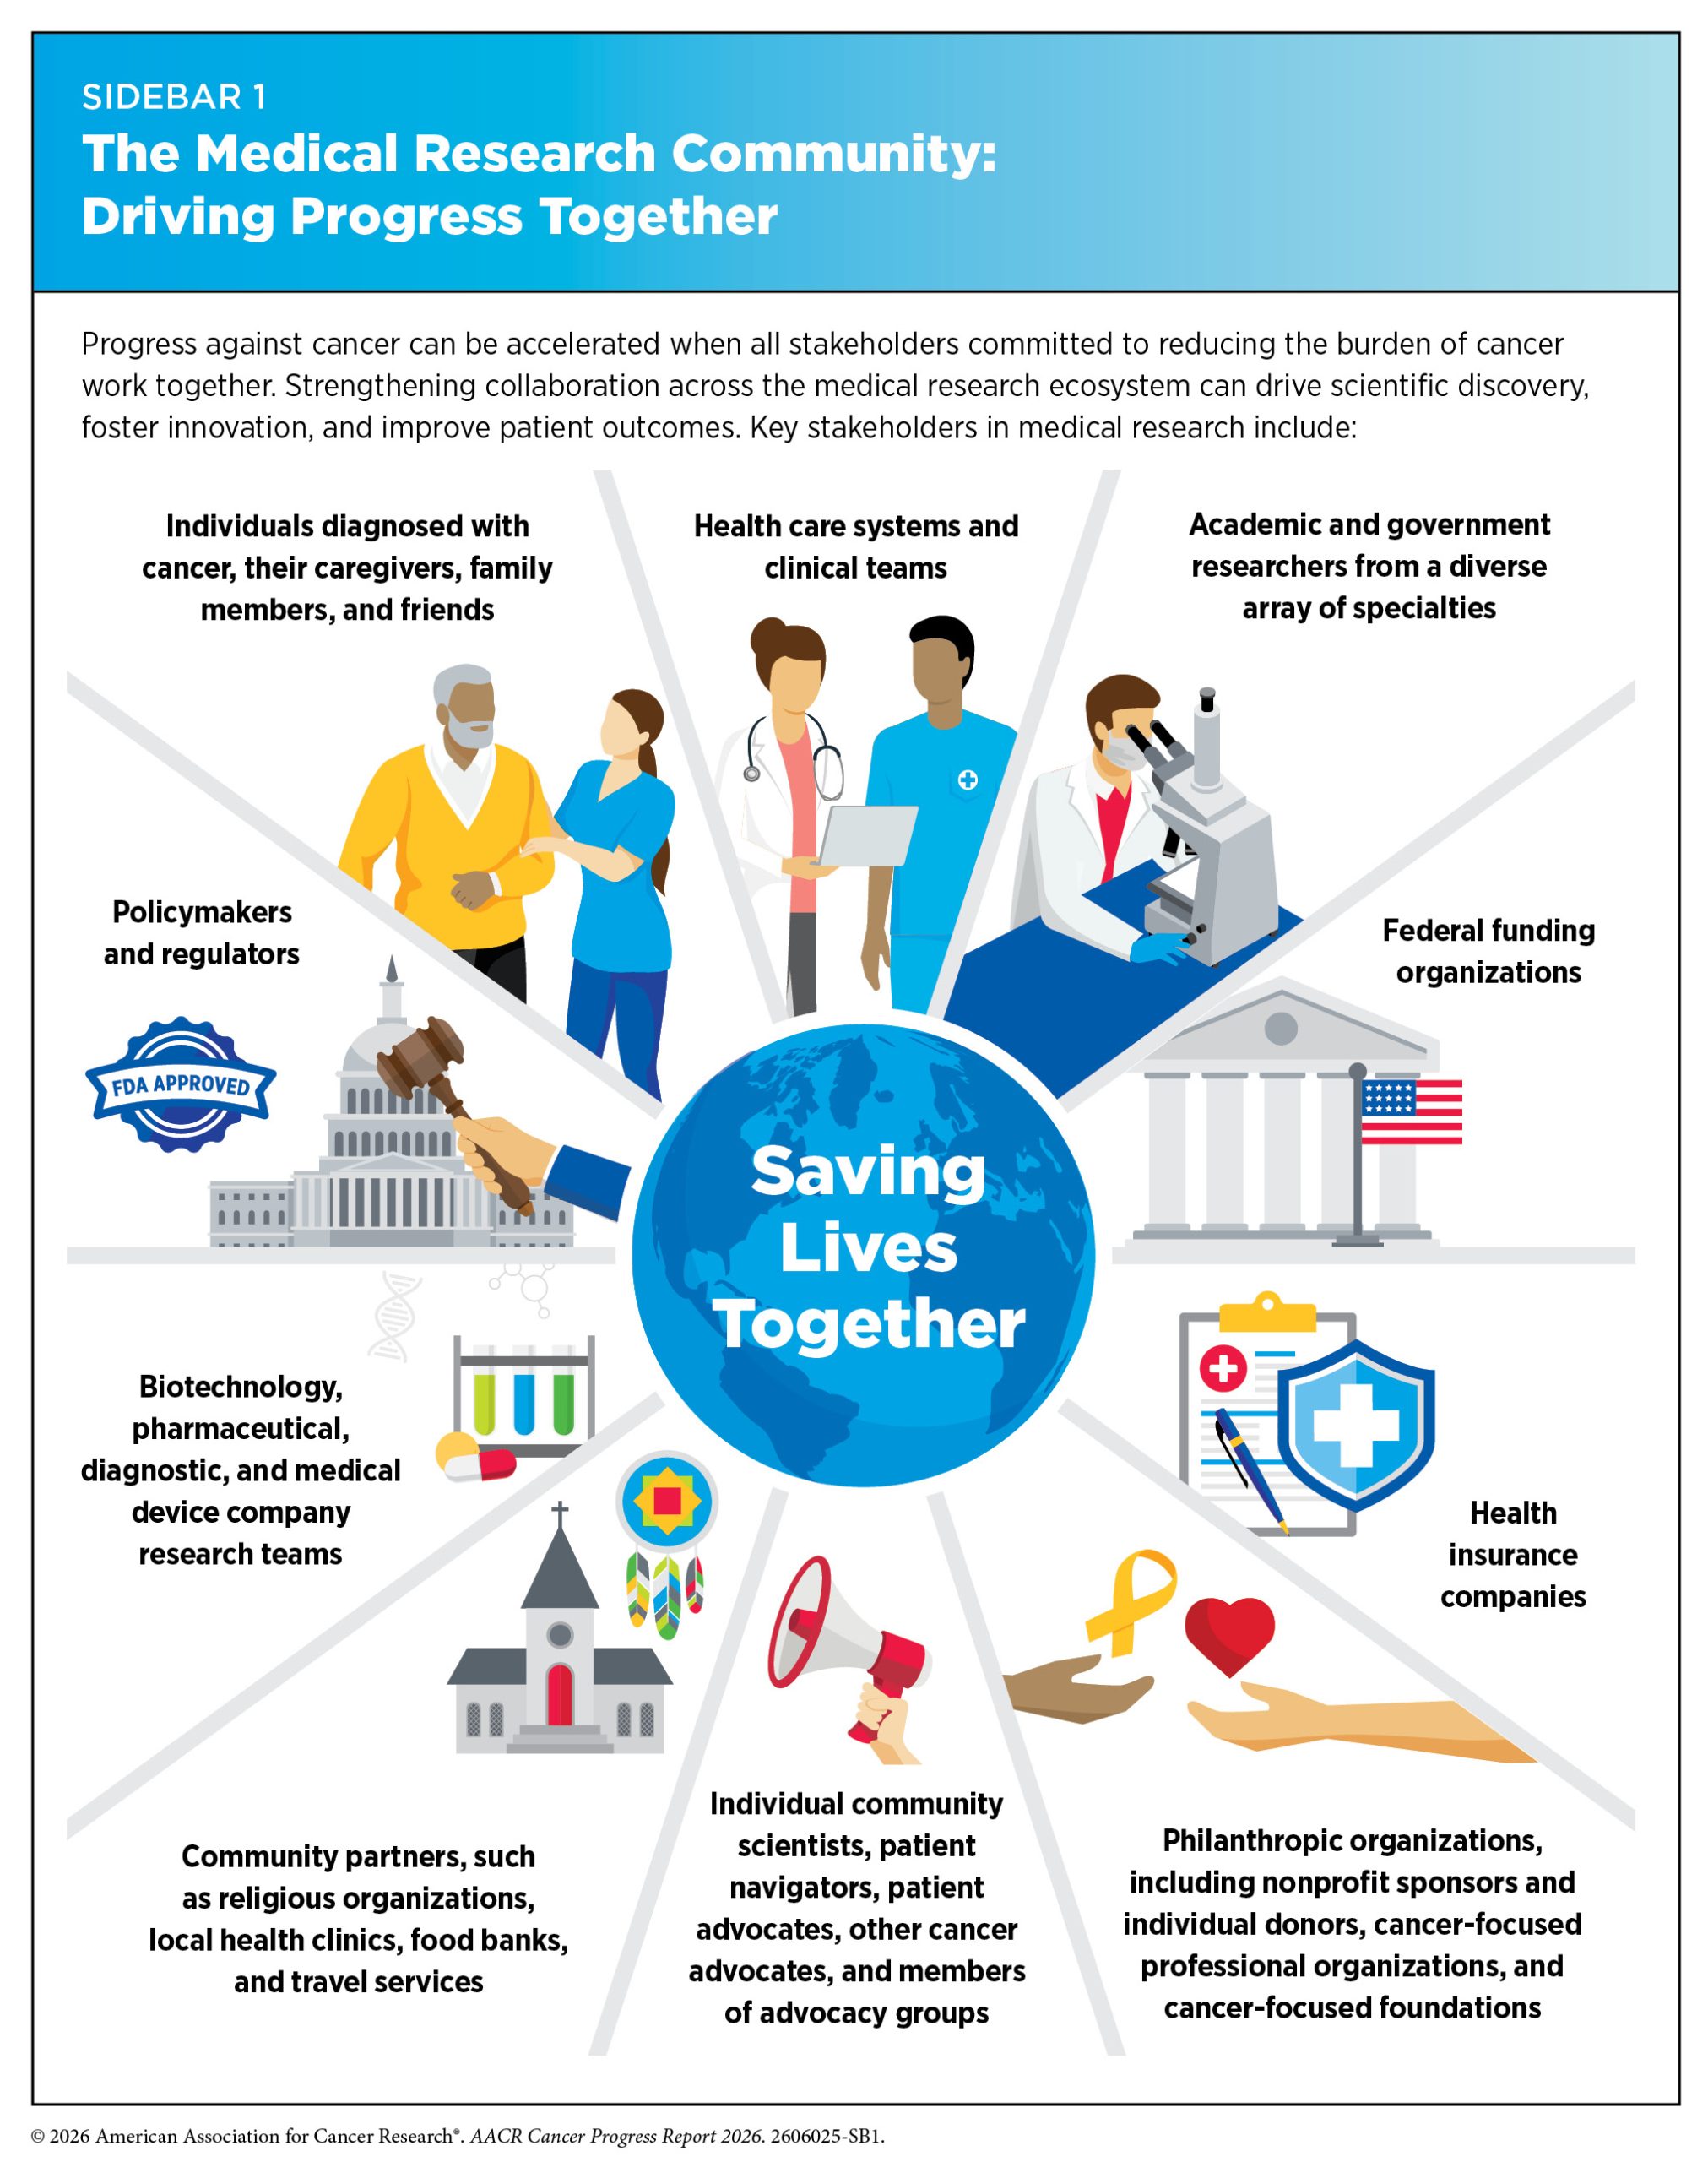
Every scientific innovation and effective policy that drives progress against cancer represents the culmination of a complex process shaped by years of coordinated effort and multidisciplinary collaboration among diverse stakeholders (see Sidebar 1). Together, these efforts have led to remarkable advances against cancer. Between 1991 and 2024, the age-adjusted overall cancer mortality rate in the United States (US) declined by 35 percent, a reduction that translates into more than 4.8 million cancer deaths averted (1)NCI Surveillance, Epidemiology, and End Results Program. NCI SEER*Explorer. Accessed: June 30, 2026.(2)Siegel RL, et al. (2026) CA Cancer J Clin, 76: e70043.. The contribution of treatment advances to declines in cancer mortality has accelerated over the past decade. A recent study estimated that advances in cancer therapies and improved access to care prevented 173,900 cancer deaths among US cancer patients diagnosed between 2010 and 2019 (3)Shiels MS, et al. (2025) J Natl Cancer Inst, 117: 2089..
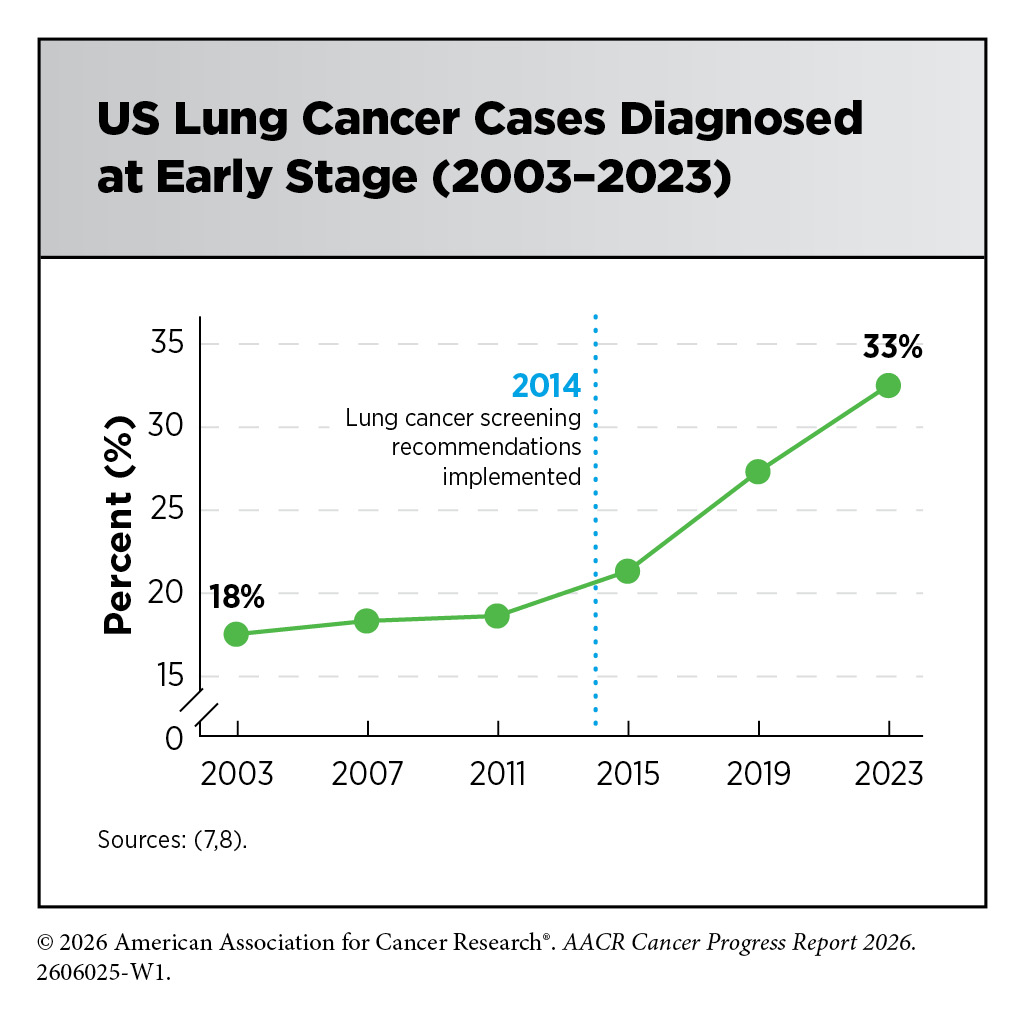
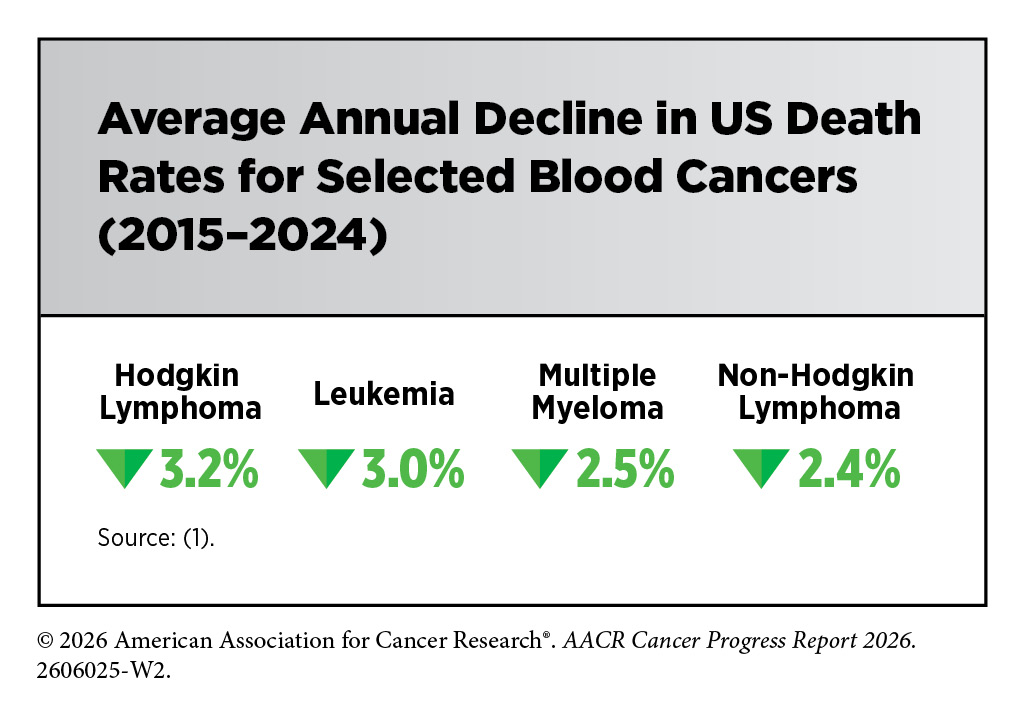
The steady decline in overall US cancer mortality is largely driven by decreased smoking rates and subsequent declines in lung cancer deaths, a trend that has accelerated in recent years due to advances in early detection and treatment (2)Siegel RL, et al. (2026) CA Cancer J Clin, 76: e70043.. Declines in death rates for colorectal cancer (CRC) and female breast cancer have also played a key role in reducing overall US cancer mortality. From 1989 to 2024, the US female breast cancer mortality rate declined by 44 percent, a reduction that translates into an estimated 546,000 fewer breast cancer deaths due to advances in screening mammography and personalized treatments (2)Siegel RL, et al. (2026) CA Cancer J Clin, 76: e70043.(4)Caswell-Jin JL, et al. (2024) JAMA, 331: 233.. Similarly, the death rate for CRC declined by nearly 50 percent between 1990 and 2024 (1)NCI Surveillance, Epidemiology, and End Results Program. NCI SEER*Explorer. Accessed: June 30, 2026.. However, this progress has been largely limited to older adults, as mortality rates for early-onset CRC, defined as CRC diagnosed in individuals aged 18 to 49 years, have increased by approximately 1 percent per year since 2004, and CRC is now the leading cause of cancer death in this age group (5)Siegel RL, et al. (2026) JAMA. 335: 632. doi:10.1001/jama.2025.25467(6)Siegel RL, et al. (2026) CA: A Cancer Journal for Clinicians, 76: e70067.. Mortality rates have also declined over the past decade for melanoma, leukemia, and cancers of the kidney and prostate, despite stable or increasing incidence rates, further underscoring the impact of advances in treatment (1)NCI Surveillance, Epidemiology, and End Results Program. NCI SEER*Explorer. Accessed: June 30, 2026.(2)Siegel RL, et al. (2026) CA Cancer J Clin, 76: e70043..
Breakthroughs across the spectrum of cancer science and medicine have led to unprecedented progress against cancers once considered intractable. For example, groundbreaking basic research conducted during the 1960s through 1980s identified the mechanistic underpinnings of chronic myeloid leukemia (CML), a cancer of the blood and bone marrow, laying the foundation for the development of new therapies that have dramatically improved outcomes for patients with the disease (see Generating Knowledge Through Basic Research) (9)Howlader N, et al. (2023) Cancer Epidemiol Biomarkers Prev, 32: 744.. As a result, the 5-year relative survival rate for CML has more than tripled, from 22 percent in the mid-1970s to 71 percent among individuals diagnosed during 2016–2022 (1)NCI Surveillance, Epidemiology, and End Results Program. NCI SEER*Explorer. Accessed: June 30, 2026.(2)Siegel RL, et al. (2026) CA Cancer J Clin, 76: e70043.. More recently, the development of immunotherapies has markedly improved outcomes for patients with multiple myeloma, increasing the 5-year relative survival rate from 32 percent in the mid-1990s to 64 percent during 2016–2022 (1)NCI Surveillance, Epidemiology, and End Results Program. NCI SEER*Explorer. Accessed: June 30, 2026.(2)Siegel RL, et al. (2026) CA Cancer J Clin, 76: e70043..
Other historically lethal cancers have also experienced meaningful, though more modest, improvements in survival. For example, the 5-year relative survival rate for liver cancer has increased three-fold, from 7 percent in the mid-1990s to 22 percent for individuals diagnosed during 2016–2022 (1)NCI Surveillance, Epidemiology, and End Results Program. NCI SEER*Explorer. Accessed: June 30, 2026.(2)Siegel RL, et al. (2026) CA Cancer J Clin, 76: e70043.(10)Centers for Disease Control and Prevention. United States Cancer Cases and Death Statistics At a Glance. Accessed: June 30, 2026.. These gains are linked to advances in systemic therapies, which, although often not curative in advanced stages, can prolong survival (11)Brown ZJ, et al. (2023) JAMA Surg, 158: 410..
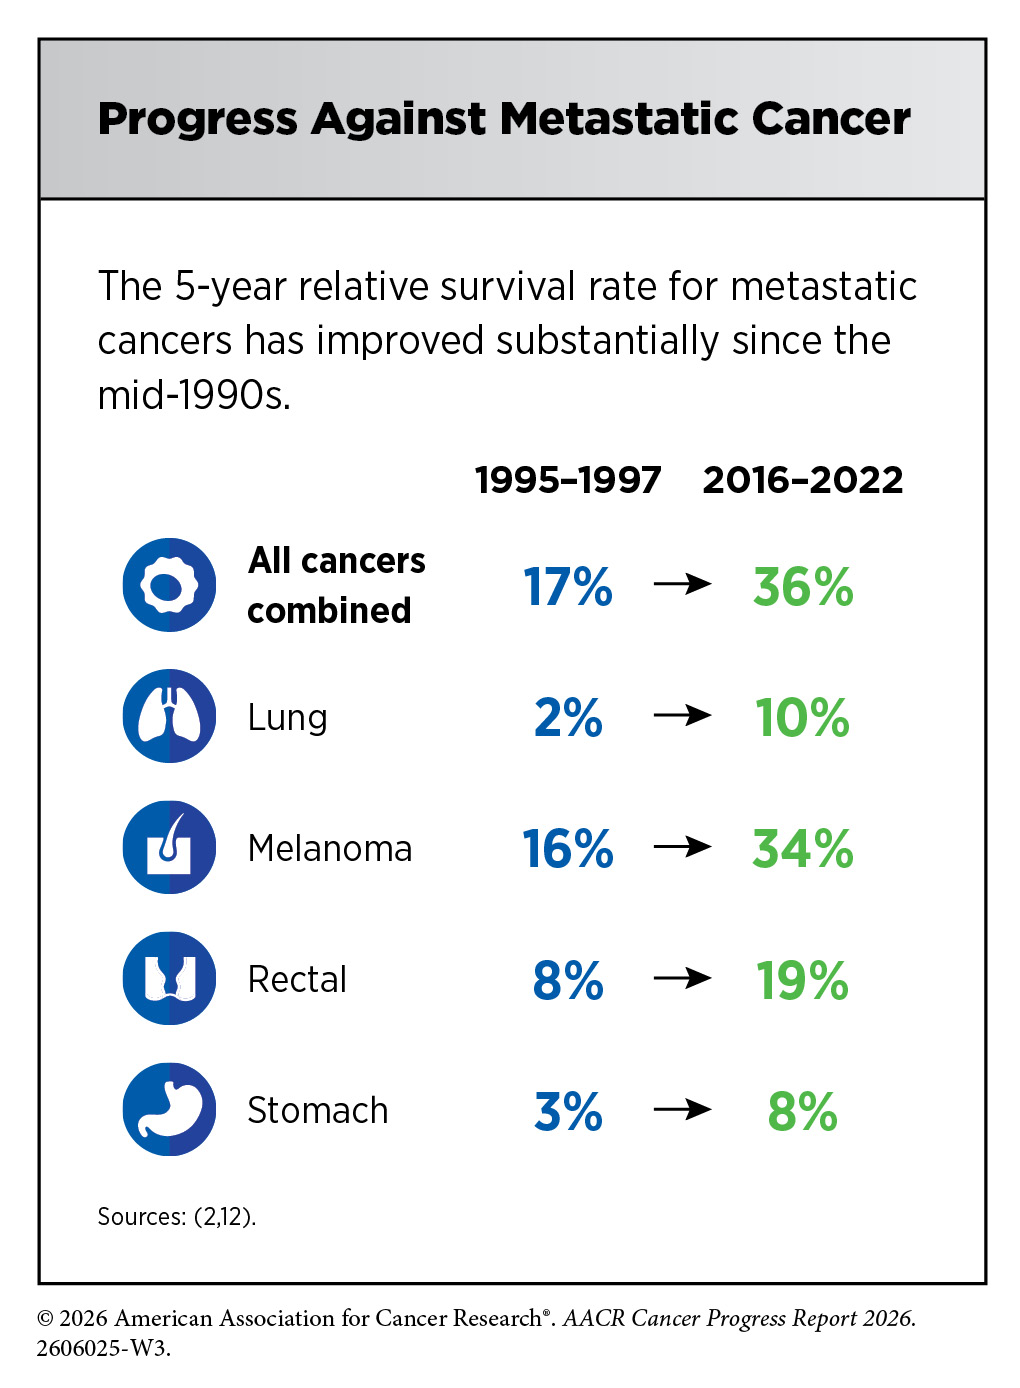
Research-driven advances have also improved survival outcomes for patients with metastatic, or distant-stage, cancer. For all cancers combined, the 5-year relative survival rate for distant-stage disease increased from 17 percent in the mid-1990s to 36 percent during 2016–2022 (2)Siegel RL, et al. (2026) CA Cancer J Clin, 76: e70043.(12)SEER*Stat Database: Incidence – SEER Research Plus Limited-Field Data, 21 Registries (excl IL), Nov 2025 Sub (2000-2023) – Linked To County Attributes – Total U.S., 1969-2024 Counties, National Cancer Institute, DCCPS, Surveillance Research Program, released April 2026, based on the November 2025 submission. Accessed: June 30, 2026.. These improvements were especially notable for distant-stage melanoma, as well as distant-stage lung and rectal cancers, for which 5-year relative survival has more than doubled since the mid-1990s.
Survival trends are also shaped by changes in the prevalence of cancer risk factors and tumor subtypes over time. For example, the 5-year relative survival rate for people diagnosed with cancers of the oral cavity and pharynx increased from 58 percent in the mid-1990s to nearly 70 percent in recent years (1)NCI Surveillance, Epidemiology, and End Results Program. NCI SEER*Explorer. Accessed: June 30, 2026.(2)Siegel RL, et al. (2026) CA Cancer J Clin, 76: e70043.. This improvement is driven, in part, by reductions in smoking-related cancers and an increase in human papillomavirus (HPV)–associated cancers, which tend to have a more favorable prognosis than HPV-negative cancers. Over the past three decades, the proportion of HPV-related oral cavity cancers—including cancers of the tongue, tonsil, and oropharynx—has increased from 37 percent to 58 percent (2)Siegel RL, et al. (2026) CA Cancer J Clin, 76: e70043..
Major advances across the clinical cancer care continuum from July 1, 2025, to June 30, 2026, include 11 new anticancer therapeutics that were approved for use by the US Food and Drug Administration (FDA). During this period, FDA also approved new uses for five previously approved anticancer therapeutics, one new device for treating pancreatic cancer, and a device for at-home sample collection for cervical cancer screening. FDA also approved a number of artificial intelligence–powered devices and software for aiding cancer risk prediction, diagnosis, and early detection.
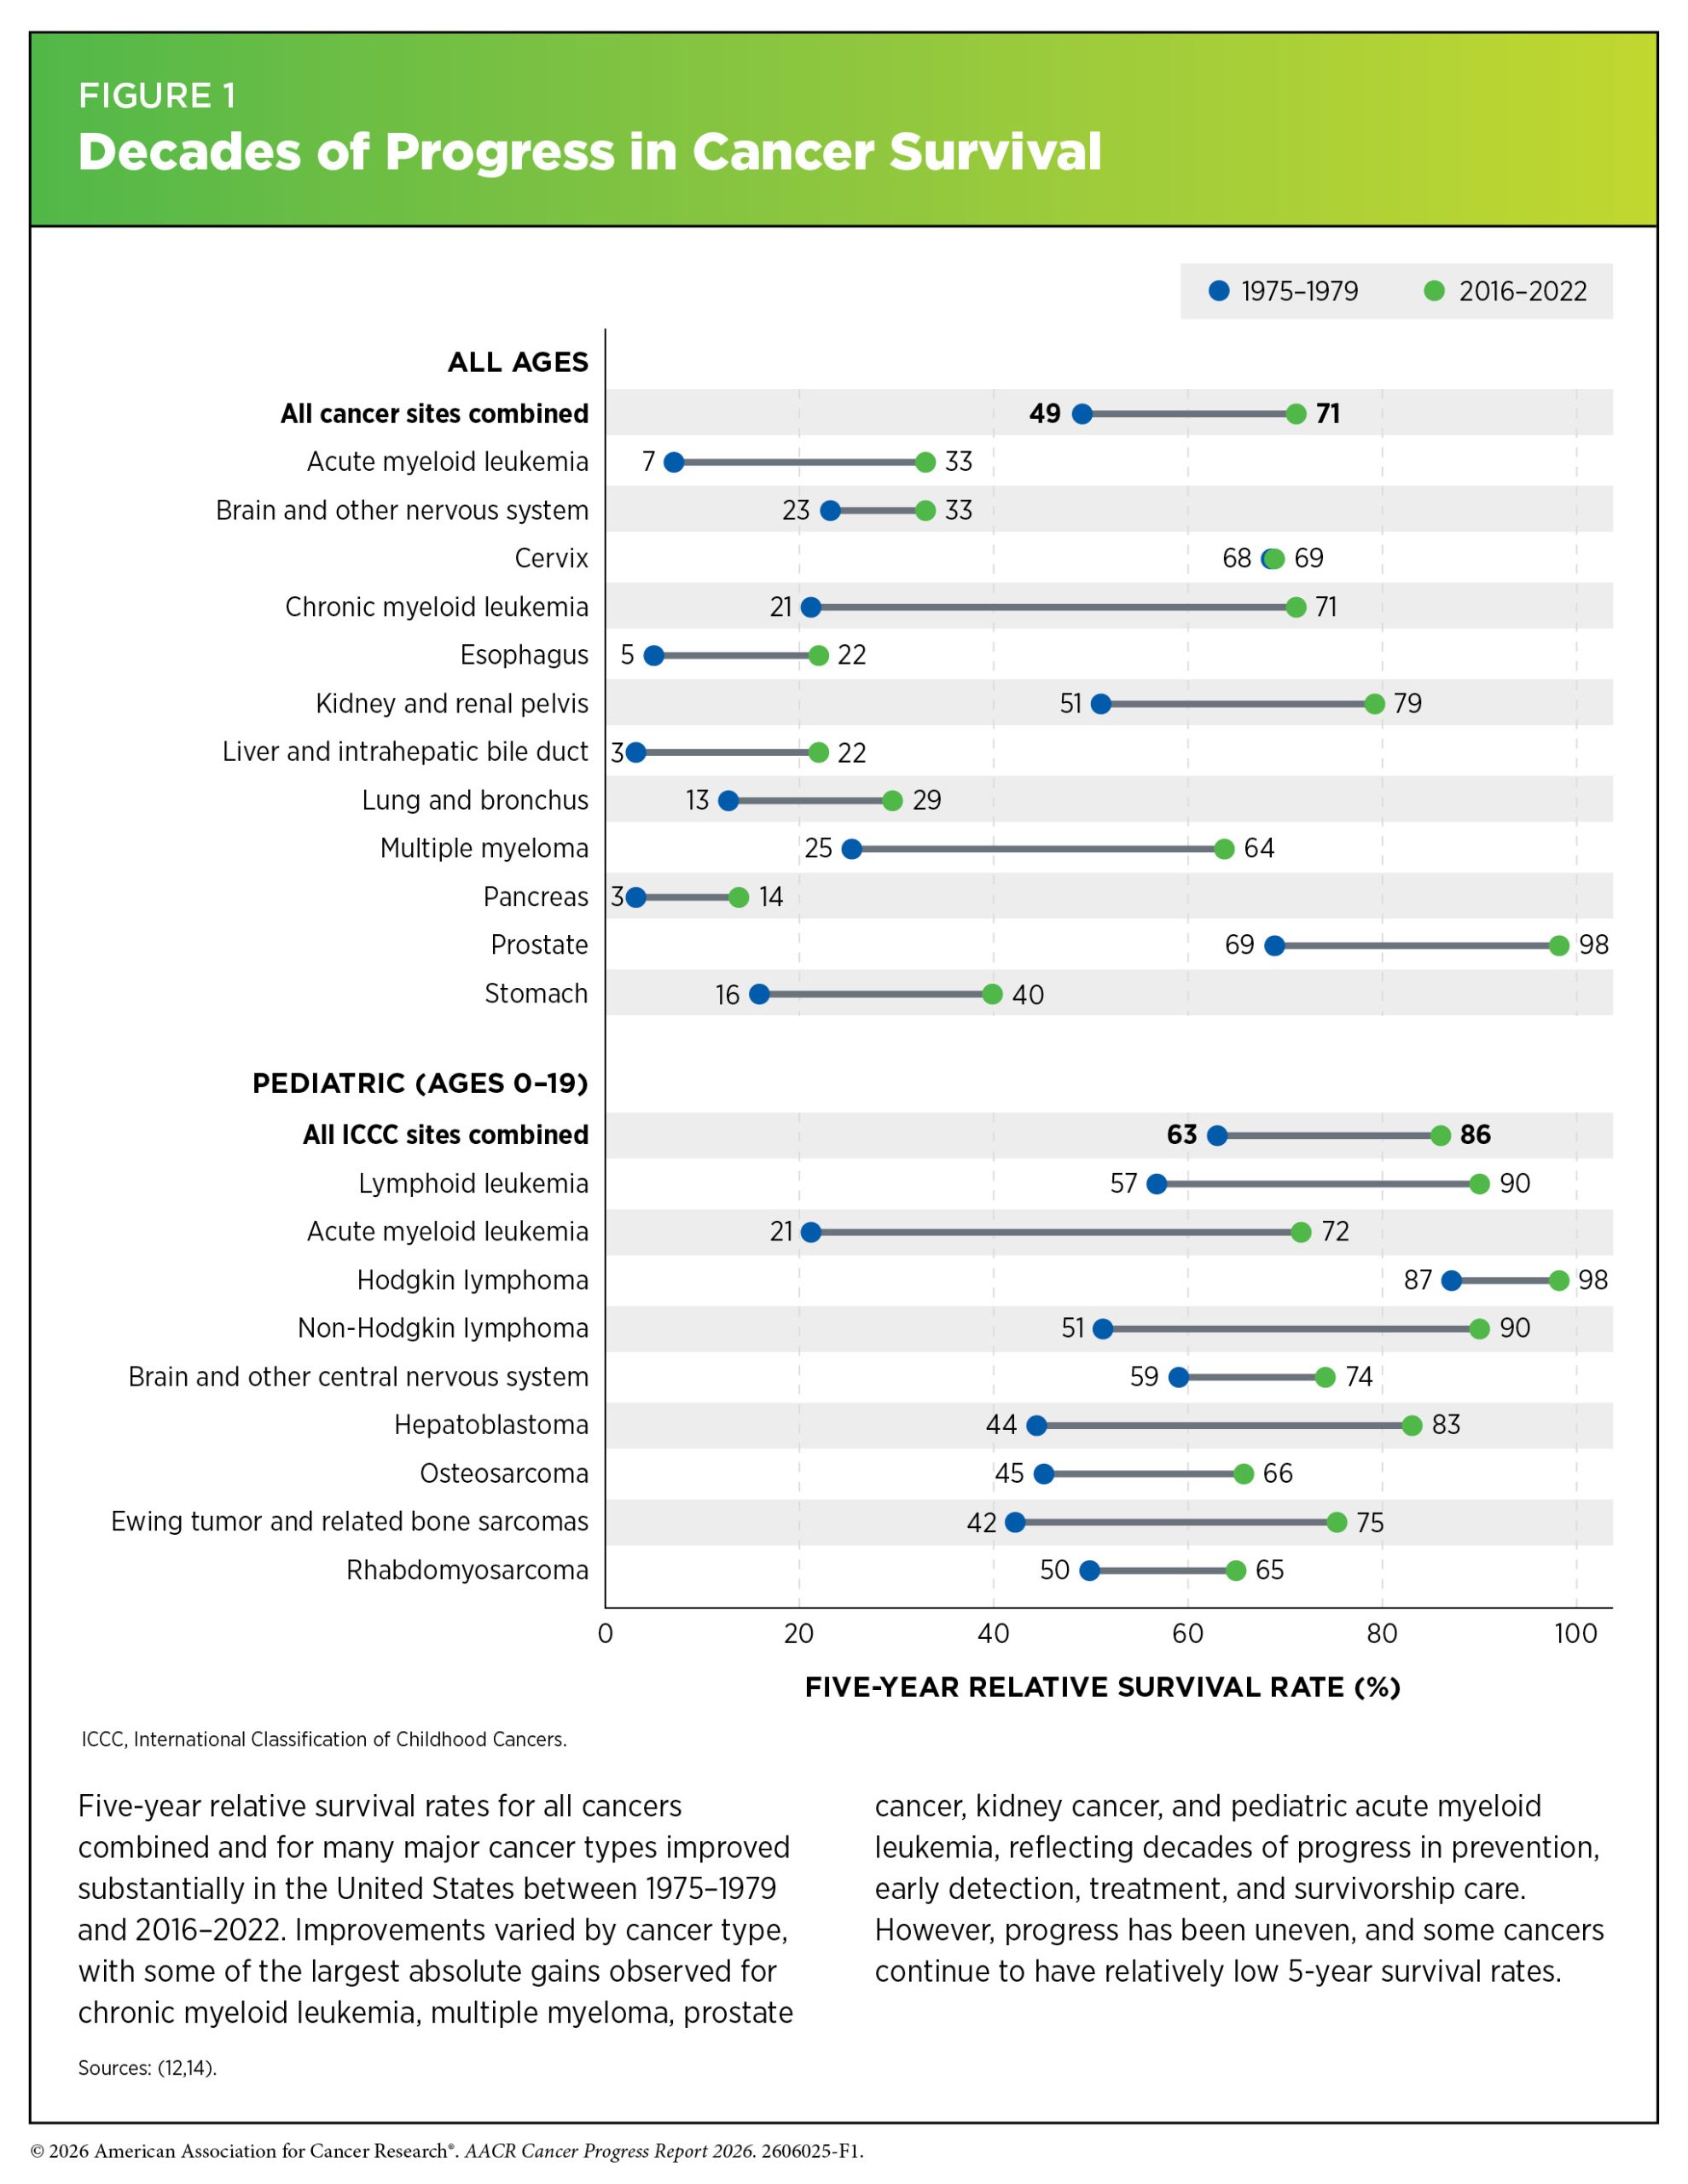
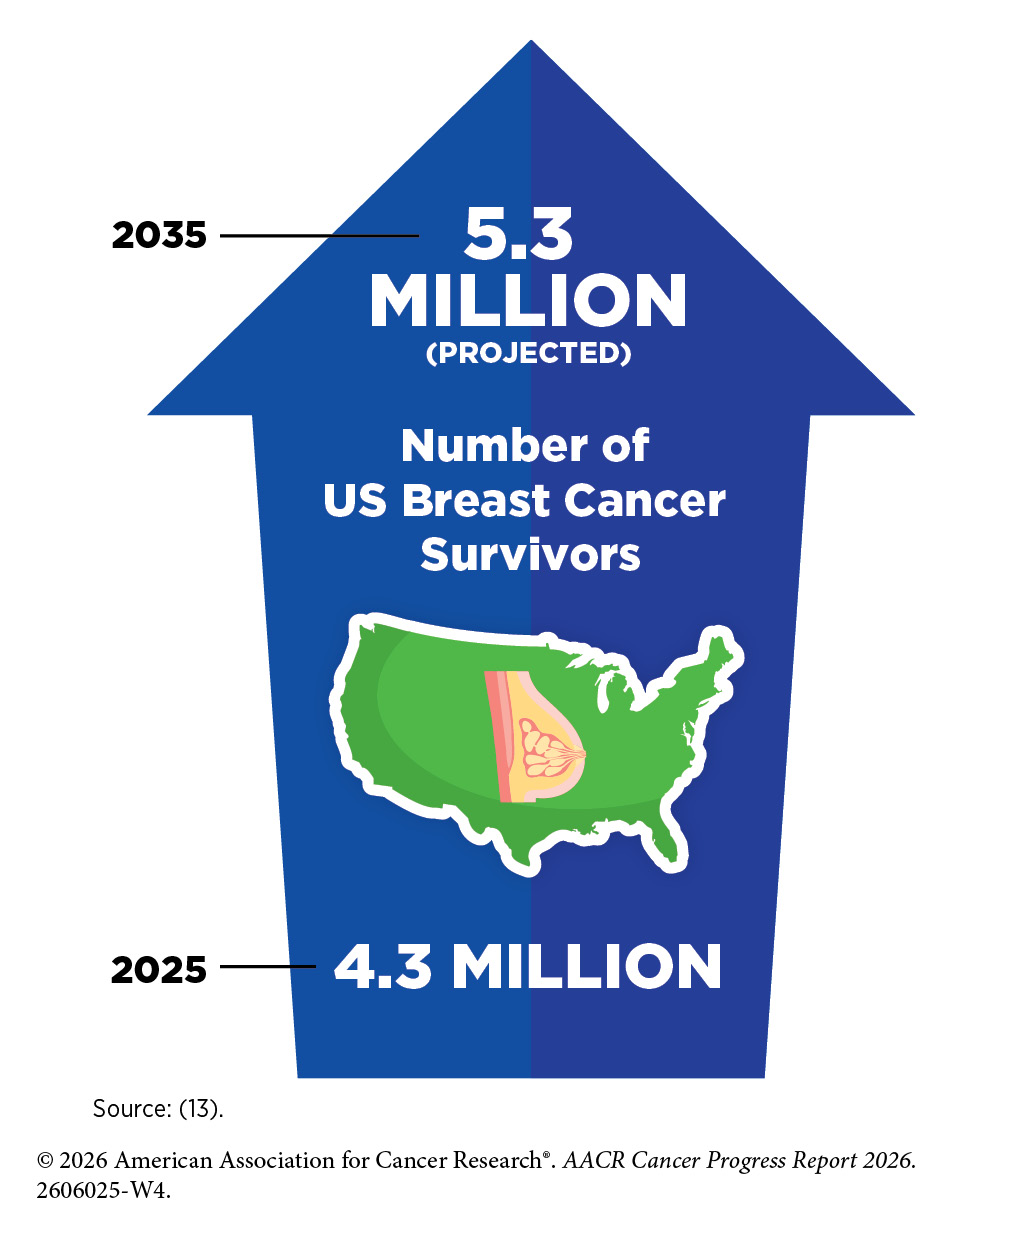
Collectively, advances such as these and those described in past editions of this annual report are helping to increase the number of children and adults who live longer and fuller lives after a cancer diagnosis. The 5-year relative survival rate for all cancers combined has increased from 49 percent among individuals diagnosed in the mid-1970s to a milestone 71 percent among those diagnosed during 2016–2022 (see Figure 1) (1)NCI Surveillance, Epidemiology, and End Results Program. NCI SEER*Explorer. Accessed: June 30, 2026.. Similar progress has been made among US children (ages 0 to 14) and adolescents (ages 15 to 19) diagnosed with cancer, whose 5-year relative survival rate for all cancers combined improved from 58 percent in the mid-1970s to 86 percent during 2016–2022 in children and from 68 percent to 88 percent in adolescents (12)SEER*Stat Database: Incidence – SEER Research Plus Limited-Field Data, 21 Registries (excl IL), Nov 2025 Sub (2000-2023) – Linked To County Attributes – Total U.S., 1969-2024 Counties, National Cancer Institute, DCCPS, Surveillance Research Program, released April 2026, based on the November 2025 submission. Accessed: June 30, 2026.(13)Wagle NS, et al. (2025) CA Cancer J Clin, 75: 308.. As of January 1, 2025, there were 18.6 million people living in the United States with a history of cancer, and this number is projected to exceed 22 million by 2035. As the population of cancer survivors continues to grow, prioritizing research that addresses their evolving needs must remain a critical focus for US medicine and public health (see Advancing Cancer Survivorship Care).
Cancer: An Ongoing Challenge
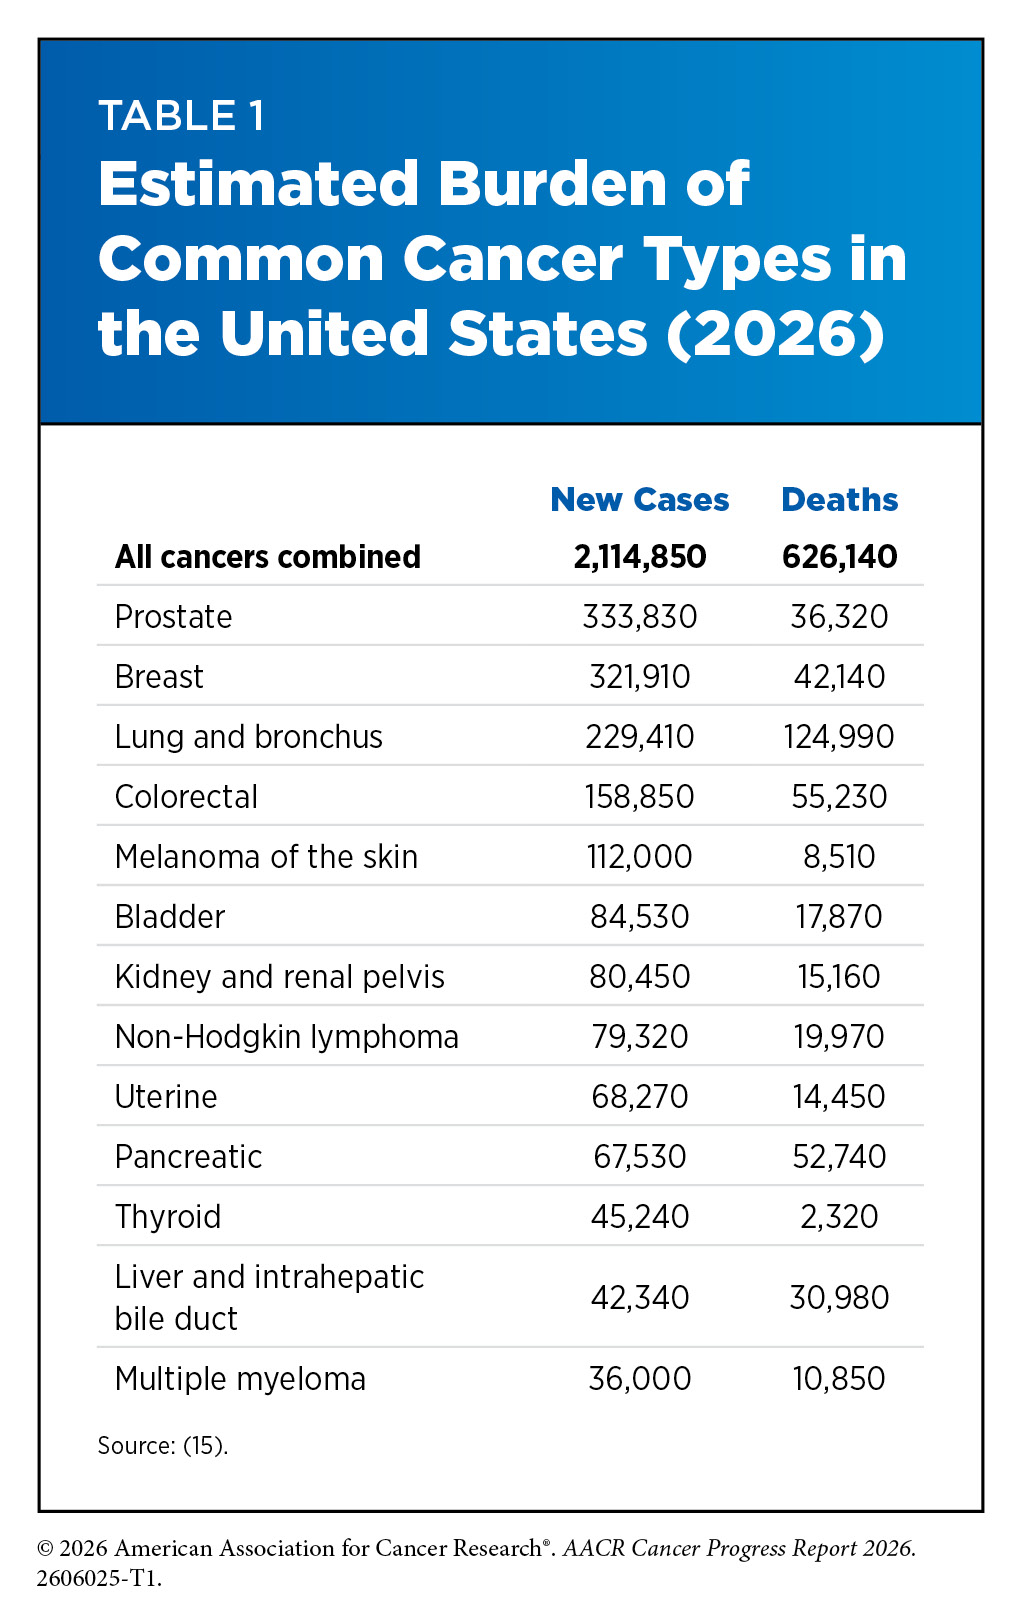
While substantial progress has been made against cancer, the disease continues to be an enormous public health challenge in the United States and around the world. In 2026, an estimated 2,114,850 new cancer cases will be diagnosed, and 626,140 people will die from the disease in the United States (see Table 1). However, the burden of cancer is not distributed equally, as many population groups in the United States continue to experience disproportionately high rates of cancer incidence and mortality.
Inequities in the Burden of Cancer in the United States
Advances in cancer prevention, early detection, treatment, and survivorship care have led to substantial improvements in cancer outcomes in the United States over the past several decades. However, these advances have not benefited everyone equally, and certain segments of the US population continue to shoulder a disproportionate burden of cancer. Cancer disparities remain one of the most pressing public health challenges in the United States. A long history of racism, segregation, and discrimination against marginalized population groups has resulted in structural inequities and societal injustices that continue to drive and perpetuate US cancer disparities. Understanding and addressing the underlying drivers of cancer disparities is essential to ensuring that advances against cancer benefit all populations.
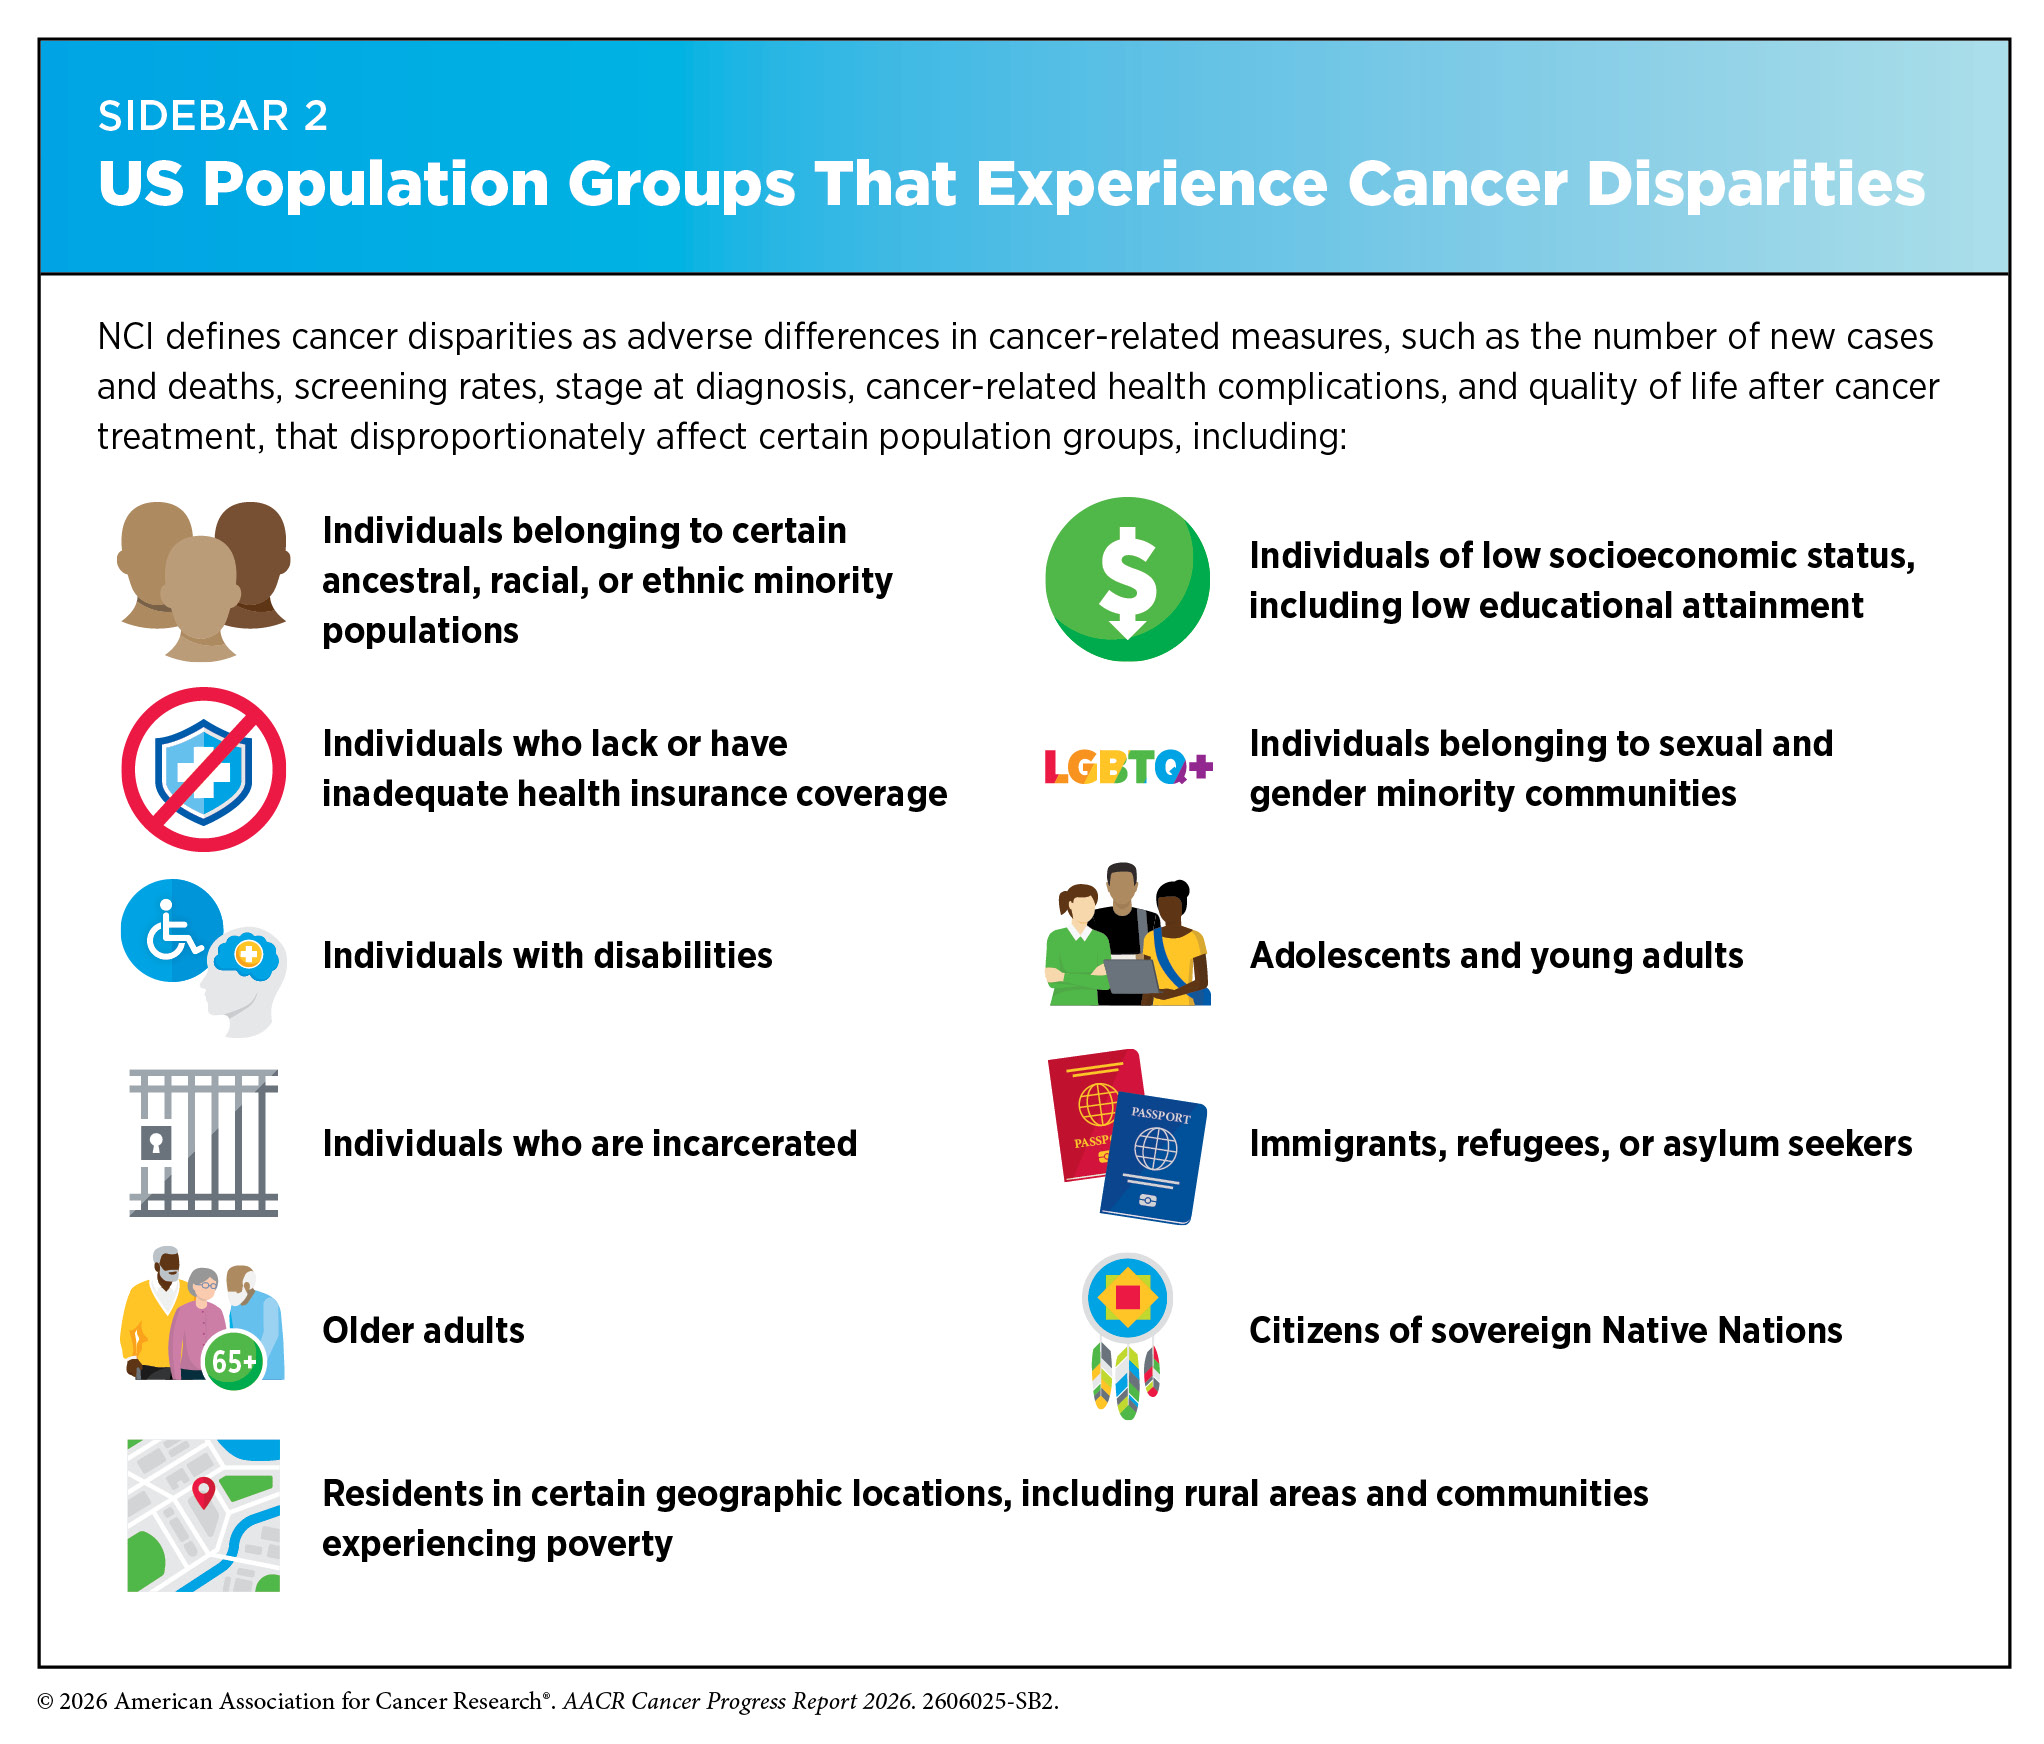
The National Cancer Institute (NCI) defines cancer disparities as adverse differences between certain population groups in cancer-related measures, including the number of new cases, the number of cancer deaths, screening rates, stage at diagnosis, cancer-related health complications, and survivorship and quality of life after treatment (see Sidebar 2).
The AACR Cancer Disparities Progress Report 2026 highlights the disproportionate burden of cancer among US racial and ethnic minority groups and other medically underserved populations (see Sidebar 3) (16)American Association for Cancer Research. AACR Cancer Disparities Progress Report 2026. Accessed: June 30, 2026.. For example, overall cancer incidence rates during 2019–2023 were highest among Black men and American Indian or Alaska Native (AIAN) women, compared to other racial and ethnic groups (1)NCI Surveillance, Epidemiology, and End Results Program. NCI SEER*Explorer. Accessed: June 30, 2026.. Similarly, Black individuals had the highest overall cancer mortality rate during 2020–2024, followed by AIAN individuals. Hispanic, Asian, and Native Hawaiian or Pacific Islander (NHPI) populations experience disproportionate burdens of infection-related cancers, such as liver and stomach cancers. Other concerning trends include increasing rates of early-onset CRC among AIAN populations as well as the rising incidence of lung cancer in Asian women who have never smoked (6)Siegel RL, et al. (2026) CA: A Cancer Journal for Clinicians, 76: e70067.(17)LoPiccolo J, et al. (2024) Nat Rev Clin Oncol, 21: 121.(18)Patel C, et al. (2026) J Clin Med, 15.. Additionally, during 2016–2022, patients with cancer from all racial and ethnic minority groups had lower 5-year relative survival rates (61.5 percent to 68.9 percent) than White individuals (71.4 percent) (1)NCI Surveillance, Epidemiology, and End Results Program. NCI SEER*Explorer. Accessed: June 30, 2026..
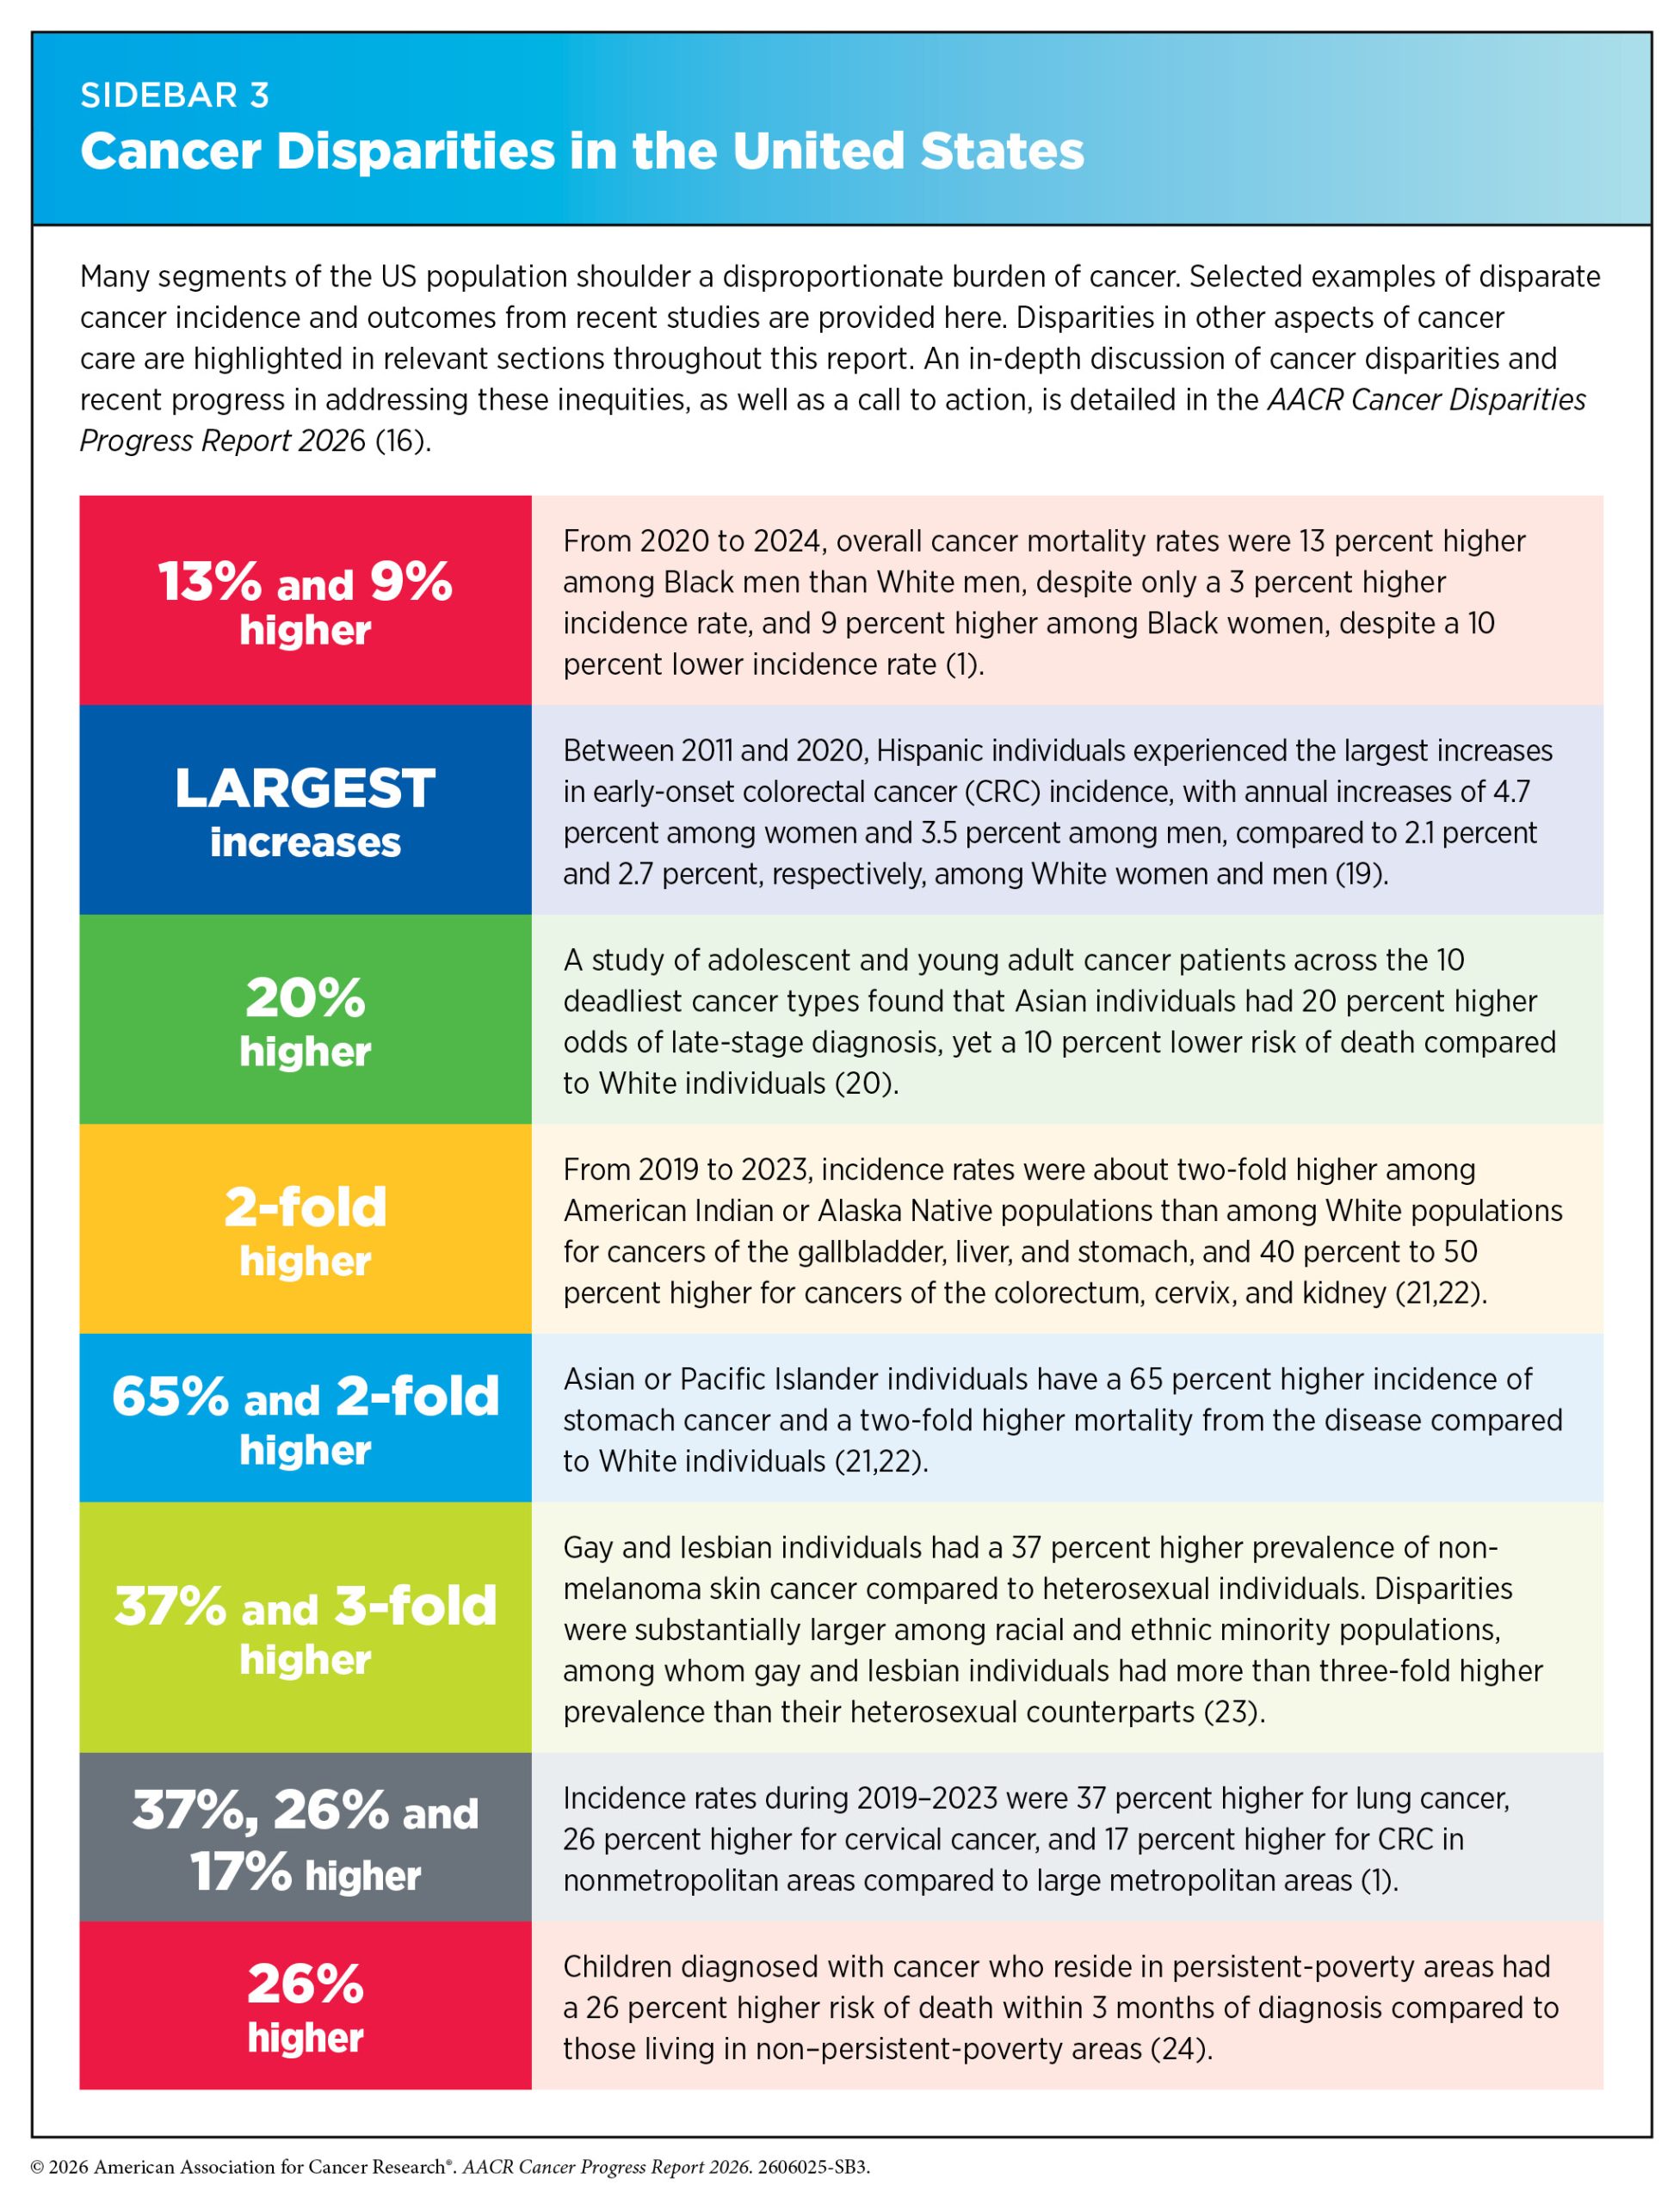
Research on the science of cancer disparities is revealing significant differences in cancer incidence and mortality across subpopulations within broad racial and ethnic categories, underscoring the need for disaggregated data. This issue is particularly relevant for Asian and NHPI populations, whose cancer statistics are often reported in aggregate, potentially masking substantial disparities between NHPI and Asian populations as well as important differences among Asian subgroups. For example, according to a recent study, Southeast Asian and NHPI individuals had 17 percent and 34 percent higher risks of death from non-Hodgkin lymphoma, respectively, compared to East Asian individuals, whereas South Asian individuals had a 16 percent lower risk (25)Chang CE, et al. (2025) Cancer Causes Control, 36: 605.. These findings highlight the importance of collecting and reporting disaggregated data to better understand and address cancer disparities within and among distinct population groups and to guide more equitable cancer control efforts.
In addition to racial and ethnic minority groups, cancer disparities persist across many segments of the US population, including rural residents, people living in persistent-poverty areas, and members of sexual and gender minority (SGM) communities. For example, overall cancer incidence (2019–2023) and mortality (2020–2024) rates were approximately 6 percent and 18 percent higher, respectively, among rural residents than among those living in urban areas (1)NCI Surveillance, Epidemiology, and End Results Program. NCI SEER*Explorer. Accessed: June 30, 2026.. Overall cancer death rates have also declined more slowly in rural counties, further widening disparities between rural and urban populations (26)Cosby AG, et al. (2026) Br J Cancer, 134: 1468.(27)Islami F, et al. (2026) J Natl Cancer Inst..
Individuals living in persistent-poverty areas also experience worse outcomes across the cancer continuum than those in non–persistent-poverty areas, including higher incidence, more advanced stage at diagnosis, and higher mortality across multiple cancer types (28)Chen JC, et al. (2024) JAMA Netw Open, 7: e2427755.(29)Karanth S, et al. (2024) Cancer Causes Control, 35: 1063..
Additionally, SGM populations experience a disproportionate burden of cancers associated with HPV and human immunodeficiency virus (HIV), including Kaposi sarcoma, anal cancer, and testicular cancer (30)Simone NL, et al. (2025) J Natl Cancer Inst Monogr, 2025: 153.. However, population-level data on cancer incidence and mortality among SGM populations remain limited, hindering efforts to fully understand and address cancer disparities in this population.
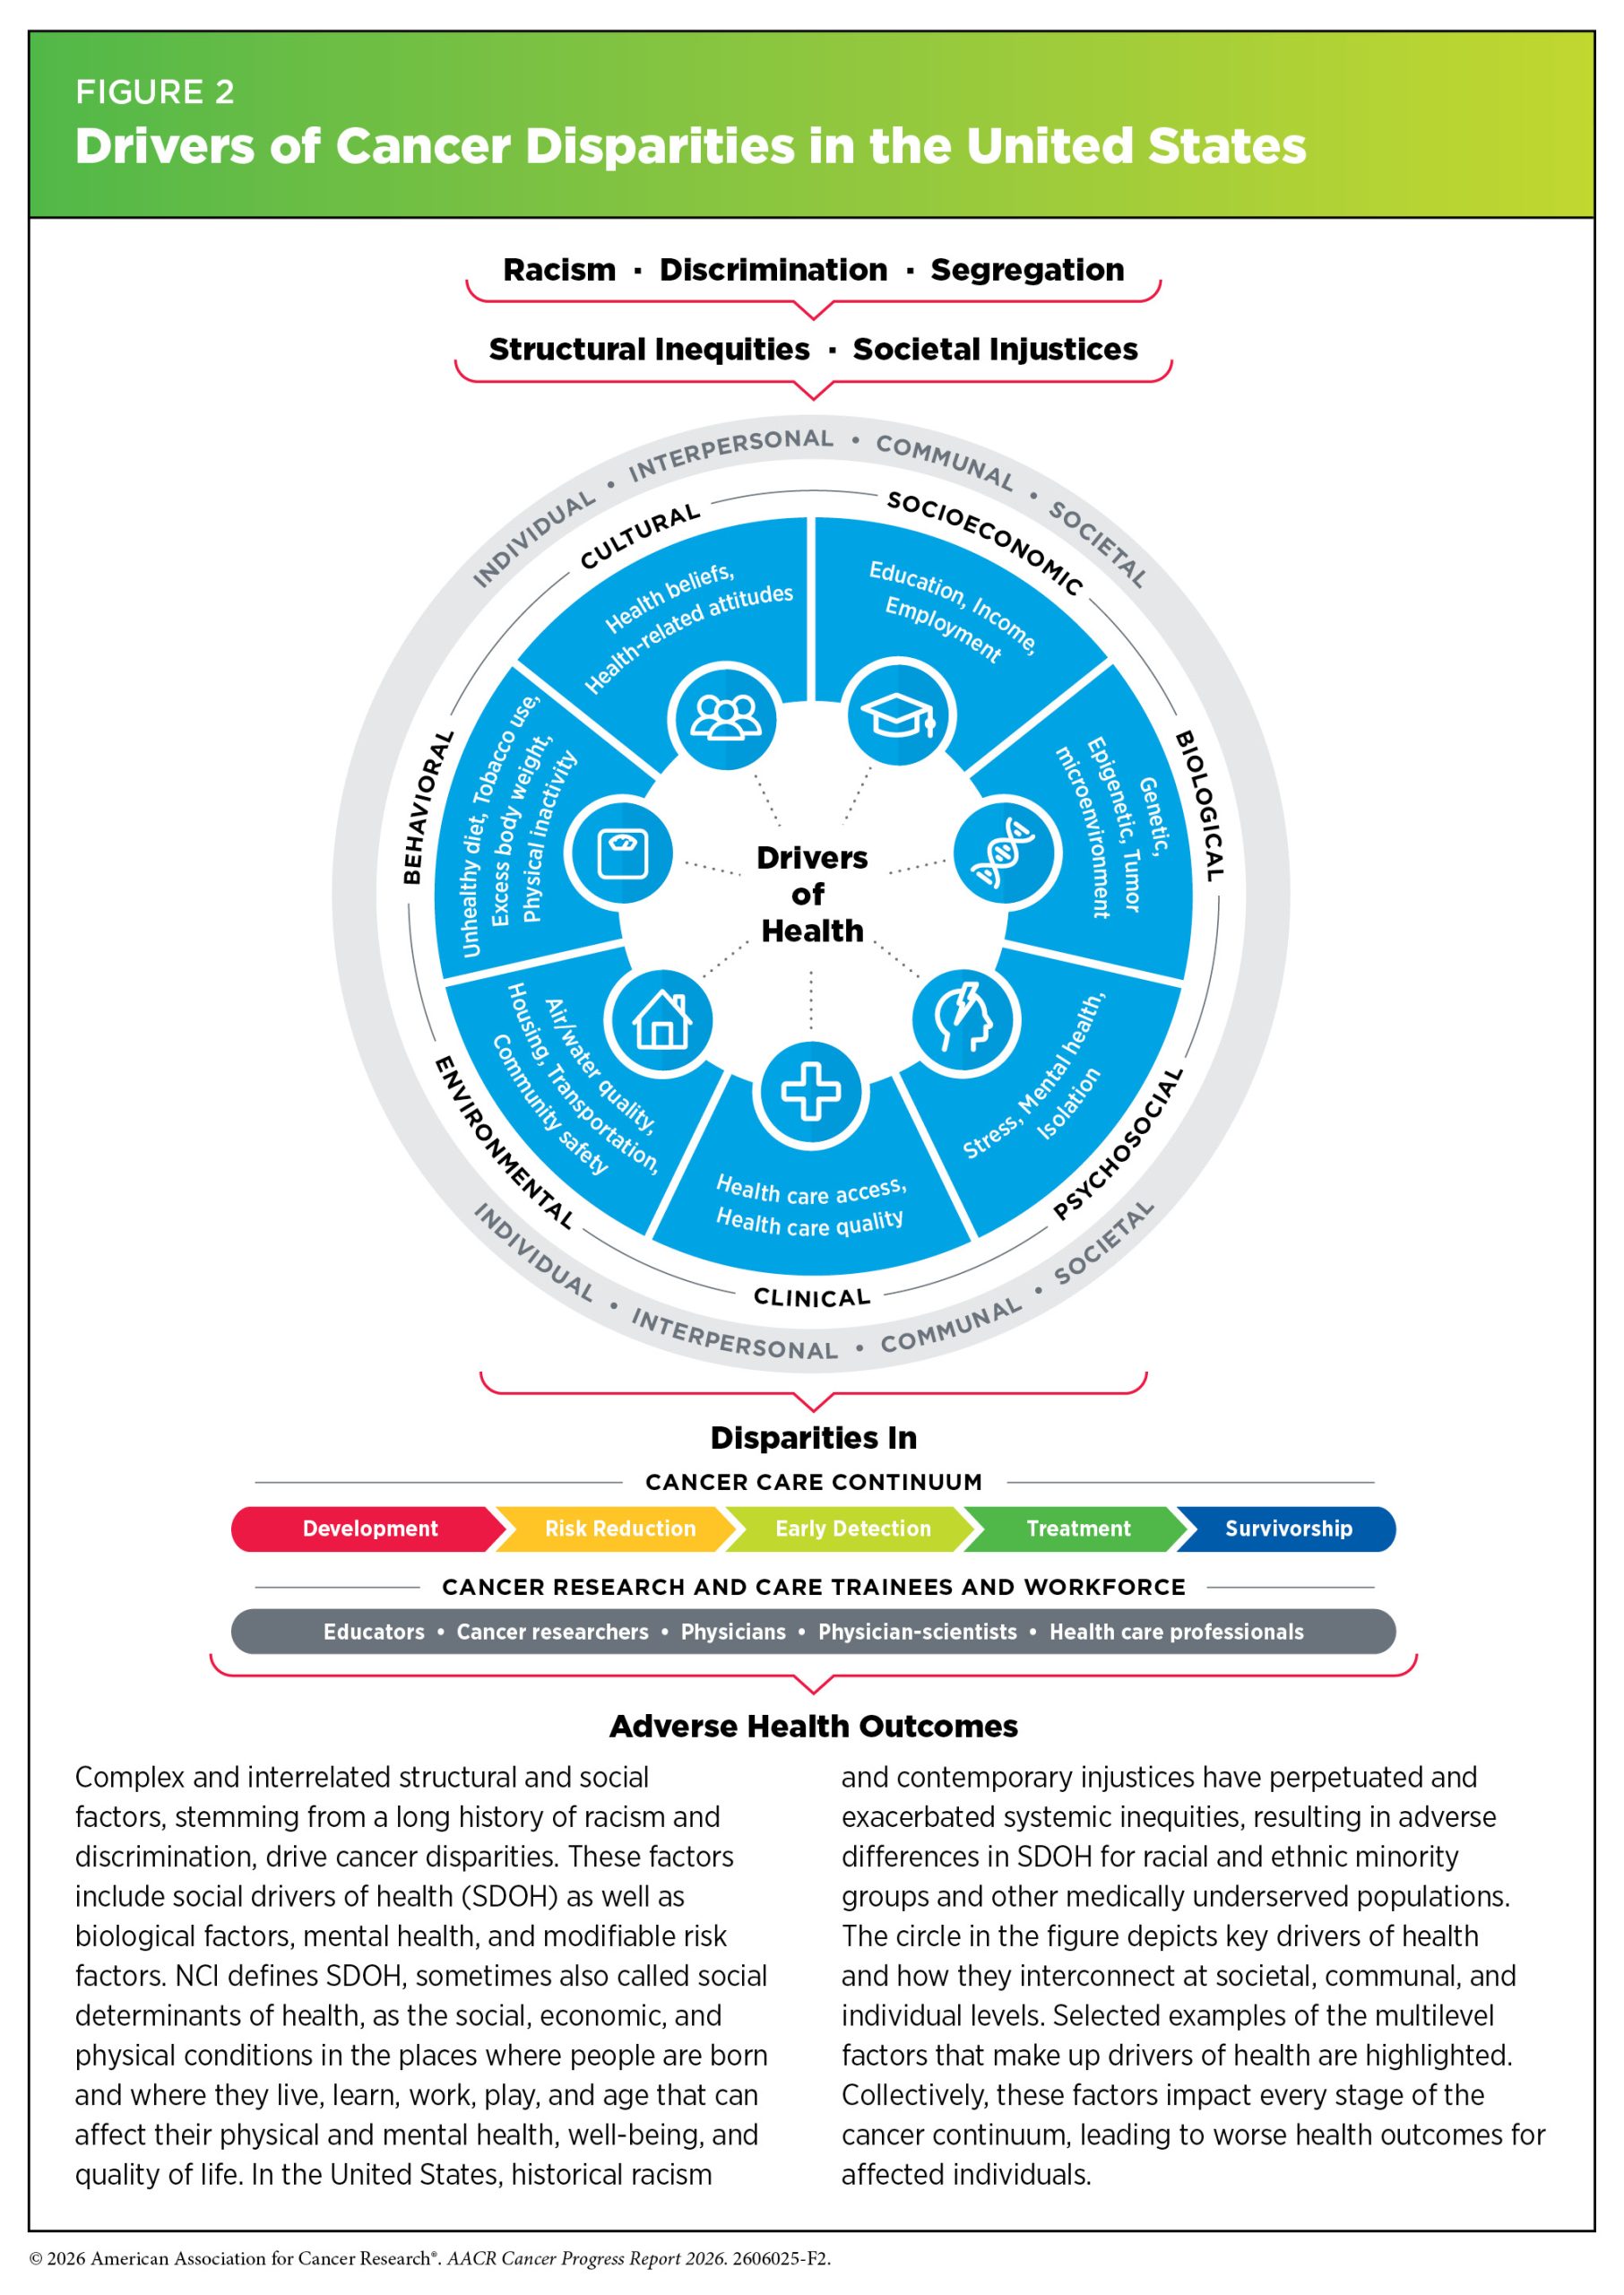
Researchers have developed several frameworks to understand and address the factors that shape health outcomes and contribute to inequities in cancer prevention, diagnosis, treatment, and survival (31)Alvidrez J, et al. (2019) Am J Public Health, 109: S16.(32)Asare M, et al. (2017) Oncol Nurs Forum, 44: 20.(33)Esteban C, et al. (2025) Int J Environ Res Public Health, 22.(34)Warnecke RB, et al. (2008) Am J Public Health, 98: 1608.. These frameworks consistently emphasize that health outcomes are shaped by a complex interplay of biological, behavioral, social, environmental, and health care system factors operating across multiple levels of influence. Increasing attention has focused on social drivers of health (SDOH) as important contributors to cancer disparities. NCI defines SDOH, also known as social determinants of health, as the social, economic, and physical conditions in the places where people are born and where they live, learn, work, play, and get older that can affect their health, well-being, and quality of life. SDOH include factors such as socioeconomic status; housing; transportation; and access to healthy food, clean air and water, and health care services (see Figure 2).
It is important to recognize that individuals with intersecting identities, such as those from racial and ethnic minority groups living in socioeconomically disadvantaged communities, often face compounding barriers to high-quality cancer care that can contribute to poorer outcomes across the cancer continuum. For example, a study examining differences in 5-year cancer survival by race and urbanicity of county of residence found that survival was generally lower among Black individuals than among White individuals and among individuals living in rural areas compared to those living in urban areas. Notably, Black individuals residing in rural areas experienced the lowest 5-year survival for all cancers combined and for several individual cancer types (35)Islami F, et al. (2025) Cancer, 131: e70073..
Inadequate access to quality health care is a major social driver of cancer disparities. In the United States, health insurance coverage is a key determinant of access to care across the cancer continuum, including cancer prevention, screening, treatment, and survivorship care services. National data show that individuals without insurance are less likely to undergo recommended cancer screening (36)American Cancer Society. Cancer Prevention & Early Detection Facts and Figures 2026. Accessed: June 30, 2026.(37)Rolle LD, et al. (2025) JAMA Oncol, 11: 784.. Insurance-related barriers also affect clinical trial enrollment and access to cancer treatment after diagnosis. For example, patients with Medicaid or no insurance are less likely than privately insured patients to enroll in cancer clinical trials (see Clinical Research) (38)Dong W, et al. (2025) J Natl Compr Canc Netw, 24.(39)Kwak M, et al. (2024) J Thorac Cardiovasc Surg, 168: 1235.. Patients without private insurance are also less likely to receive biomarker testing and newer therapies such as immunotherapy (40)Ajjawi I, et al. (2025) Breast Cancer Res Treat, 212: 299.(41)Dennis MJ, et al. (2025) JCO Precis Oncol, 9: e2400449.(42)Zhang S, et al. (2026) Melanoma Manag, 13: 2629903.. These insurance-related disparities also extend to the quality and timeliness of cancer care. Across multiple cancer types, studies show that patients without private insurance are less likely to receive guideline-concordant care and more likely to experience delays in treatment initiation, both of which are associated with worse cancer outcomes (43)Abbas M, et al. (2026) JTCVS Open: 101830.(44)Liang J, et al. (2025) Am J Obstet Gynecol, 233: 186 e1.(45)Nykaza I, et al. (2025) Lung Cancer, 206: 108661.(46)Parikh-Patel A, et al. (2026) Am J Prev Med, 71: 108333.(47)Pilehvari A, et al. (2025) Breast Cancer Res Treat, 210: 575..
The persistence of cancer disparities across multiple segments of the US population underscores the need for concerted efforts to understand and address the complex, multilevel factors that shape cancer outcomes. Achieving health equity will require sustained progress across the full spectrum of cancer science and medicine, including basic and translational research that incorporates biospecimens and data from diverse populations; clinical studies that include participants from all sociodemographic backgrounds; and health care delivery and implementation research that reflects the needs, priorities, and lived experiences of populations disproportionately affected by cancer. These efforts are critical to ensuring that advances in cancer prevention, early detection, treatment, and survivorship care translate into improved outcomes for all populations.
Variable Progress Against Different Types of Cancer and Stages of Diagnosis
Despite substantial progress in reducing the overall cancer burden in the United States, advances have been uneven across cancer types and stages. This disparity is reflected in wide variations in 5-year survival rates, which depend strongly on both the cancer type and the stage at diagnosis.
For example, between 2016 and 2022, the overall 5-year relative survival rate was 13.7 percent for pancreatic cancer and 6.6 percent for glioblastoma multiforme, an aggressive form of brain cancer. These figures stand in stark contrast to 91.9 percent for breast cancer and 98.2 percent for prostate cancer (12)SEER*Stat Database: Incidence – SEER Research Plus Limited-Field Data, 21 Registries (excl IL), Nov 2025 Sub (2000-2023) – Linked To County Attributes – Total U.S., 1969-2024 Counties, National Cancer Institute, DCCPS, Surveillance Research Program, released April 2026, based on the November 2025 submission. Accessed: June 30, 2026.. However, these overall estimates obscure important stage-specific differences. Among individuals diagnosed with localized disease—cancer confined to the breast or prostate—the 5-year relative survival rate approaches 100 percent. In contrast, those diagnosed with distant or metastatic disease—cancer that has spread to other organs—have markedly lower 5-year survival rates of 33.8 percent for breast cancer and 40.1 percent for prostate cancer (12)SEER*Stat Database: Incidence – SEER Research Plus Limited-Field Data, 21 Registries (excl IL), Nov 2025 Sub (2000-2023) – Linked To County Attributes – Total U.S., 1969-2024 Counties, National Cancer Institute, DCCPS, Surveillance Research Program, released April 2026, based on the November 2025 submission. Accessed: June 30, 2026.. These patterns underscore the critical importance of early detection and diagnosis.
Despite these advances, substantial challenges remain for cancers with persistently high mortality. Lung cancer is the third most commonly diagnosed cancer in the United States and remains the leading cause of cancer-related death. Although the lung cancer mortality rate has declined by more than half since 1990 (from 58.8 to 27.9 deaths per 100,000 individuals), it remains higher than that of any other cancer (1)NCI Surveillance, Epidemiology, and End Results Program. NCI SEER*Explorer. Accessed: June 30, 2026.. This burden is partly attributable to late-stage diagnosis, as 46.5 percent of lung cancers are diagnosed at advanced stages, compared to 6.1 percent for breast cancer. Low screening uptake also contributes to this disparity. Among cancers with recommended screening, lung cancer has the lowest participation rate, with only 13 percent of eligible individuals reporting a low-dose computed tomography screening test in the past year, compared to 80 percent for breast cancer (see Cancer Screening for Early Detection) (36)American Cancer Society. Cancer Prevention & Early Detection Facts and Figures 2026. Accessed: June 30, 2026.. Differences in screening uptake contribute to later-stage diagnosis and higher mortality.
However, disparities in cancer outcomes are not limited to stage at diagnosis. Survival also varies dramatically across cancer types, reflecting differences in disease biology and treatment advances. For example, substantial advances in the treatment of pediatric acute lymphoblastic leukemia have increased 5-year survival to more than 90 percent, whereas diffuse midline glioma—a rare, aggressive brain tumor with limited treatment options—remains among the deadliest pediatric cancers, with a 3 percent 5-year survival rate (12)SEER*Stat Database: Incidence – SEER Research Plus Limited-Field Data, 21 Registries (excl IL), Nov 2025 Sub (2000-2023) – Linked To County Attributes – Total U.S., 1969-2024 Counties, National Cancer Institute, DCCPS, Surveillance Research Program, released April 2026, based on the November 2025 submission. Accessed: June 30, 2026.(48)NCI Childhood Cancer Data Initiative. NCI NCCR*Explorer. Accessed: June 30, 2026..
These stark differences underscore that the advances in cancer research, prevention, early detection, and treatment have not been realized equally across all cancer types, highlighting the need for continued innovation and targeted efforts to improve outcomes for cancers with consistently poor outcomes.
The Growing Population Burden of Cancer
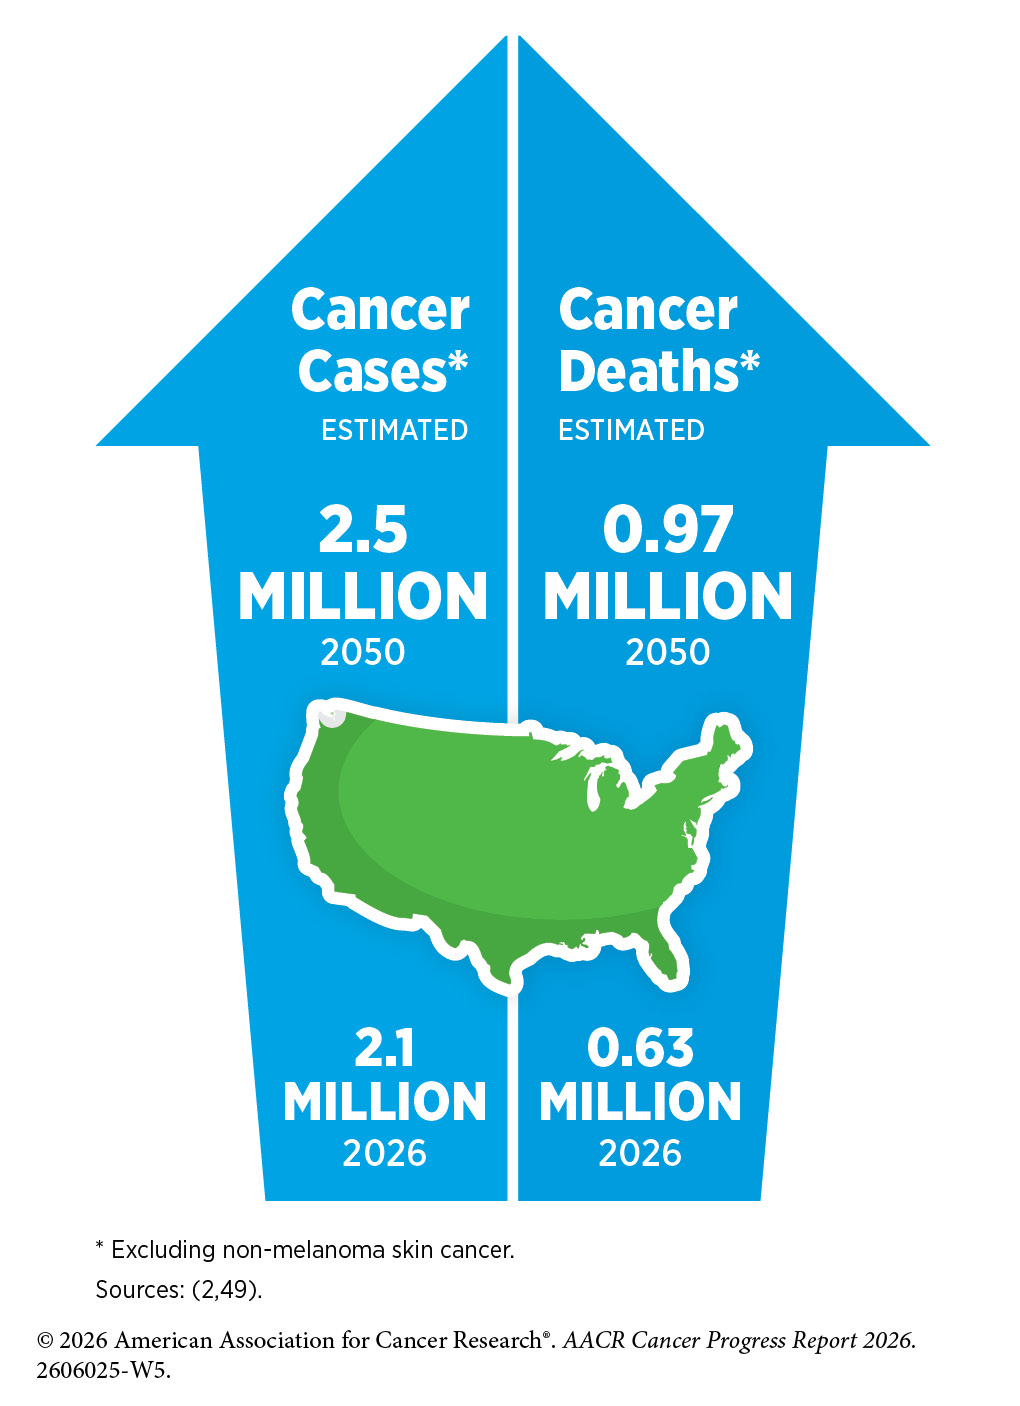
The burden of cancer as a public health issue is expected to grow substantially in the coming decades unless more effective approaches to prevention, early detection, and treatment are put in place. In the United States, the annual number of newly diagnosed cancer cases, excluding non-melanoma skin cancer, is projected to surpass 2.5 million by 2050—representing a 19 percent increase from the estimated 2.1 million cases expected in 2026 (2)Siegel RL, et al. (2026) CA Cancer J Clin, 76: e70043.(49)International Agency for Research on Cancer. Global Cancer Observatory. Accessed: June 30, 2026..
A key factor driving this increase is the aging population, as the likelihood of developing cancer rises markedly with age. Currently, about 60 percent of all cancer diagnoses occur among individuals age 65 and older (2)Siegel RL, et al. (2026) CA Cancer J Clin, 76: e70043.. By 2050, this age group is expected to grow to more than 82 million people, accounting for approximately 23 percent of the US population. This reflects nearly a 50 percent increase from 2022, when there were about 58 million older adults, making up roughly 17 percent of the population (50)US Census Bureau. 2023 National Population Projections Tables. Accessed: June 30, 2026.. Interestingly, the proportion of cancer cases occurring in adults age 65 and older has remained relatively stable over time, changing only from 61 percent in 1995 to 60 percent in 2022 (2)Siegel RL, et al. (2026) CA Cancer J Clin, 76: e70043..
An increase in exposure to several modifiable risk factors may also contribute to the rising number of cancer cases in the United States. These include the high prevalence of excess body weight, low levels of physical activity, alcohol use, environmental exposures, and ongoing tobacco use (see Reducing the Risk of Cancer Development). Although smoking rates have declined markedly since the 1970s, about 12.6 percent of US adults still use combustible tobacco products, such as cigarettes or cigars (51)Agaku I (2026) NEJM Evid, 5: EVIDpha2500339..
Cigarette smoking remains the leading cause of lung cancer. However, the frequency of lung cancer diagnosed in individuals who have never smoked is rising. Globally, an estimated 15 percent to 20 percent of lung cancer cases occur in people with no history of smoking (52)Murphy C, et al. (2025) JAMA, 334: 1836.. Recent studies show that lung cancer in never-smokers differs from smoking-related lung cancer in both tumor characteristics and disease patterns (52)Murphy C, et al. (2025) JAMA, 334: 1836.(53)Caswell DR, et al. (2026) Trends in Cancer, 12: 310.. These cancers are most often adenocarcinomas, which originate in mucus-producing cells. Lung cancer in never-smokers also occurs more frequently in women, in individuals of Asian ancestry, and often contain specific genetic alterations that can be treated with molecularly targeted therapeutics, as was the case with Sydney Barned, MD (52)Murphy C, et al. (2025) JAMA, 334: 1836..
As the number of lung cancers continues to rise in individuals who have never smoked, there is critical need to identify unique risk factors, conduct in-depth characterization of the disease, and develop evidence-based strategies for early detection and treatment to reduce the burden of lung cancer in patients without a history of smoking.
Another rising concern among public health experts is the steadily increasing incidence of certain cancer types among individuals ages 18 to 49, a phenomenon referred to as early-onset cancer. Notably, this age group is the only one to have experienced a consistent increase in overall cancer incidence in the United States between 1995 and 2021. Globally, cancer incidence among individuals under the age of 50 increased by nearly 80 percent between 1990 and 2019 (55)Andre F, et al. (2025) ESMO Open, 10: 105553.. This trend is reflected in patterns across a subset of cancers. Between 2010 and 2019, incidence rates rose for 14 cancer types among US individuals ages 15 to 49, including melanoma; certain lymphomas; and cancers of the cervix, colon, breast, pancreas, stomach, testicles, and uterus (56)Shiels MS, et al. (2025) Cancer Discov, 15: 1363..
In the United States, these rising rates also reveal notable sex disparities. Cancer incidence among individuals younger than 50 years is higher in women than in men, and this gap has widened over time. In 2023, the incidence of new cancers in this age group was 78 percent higher in females than in males (149.4 vs. 83.9 per 100,000 individuals), compared to a 55 percent difference in 2003 (118.1 vs. 76.2 per 100,000 individuals) (12)SEER*Stat Database: Incidence – SEER Research Plus Limited-Field Data, 21 Registries (excl IL), Nov 2025 Sub (2000-2023) – Linked To County Attributes – Total U.S., 1969-2024 Counties, National Cancer Institute, DCCPS, Surveillance Research Program, released April 2026, based on the November 2025 submission. Accessed: June 30, 2026..
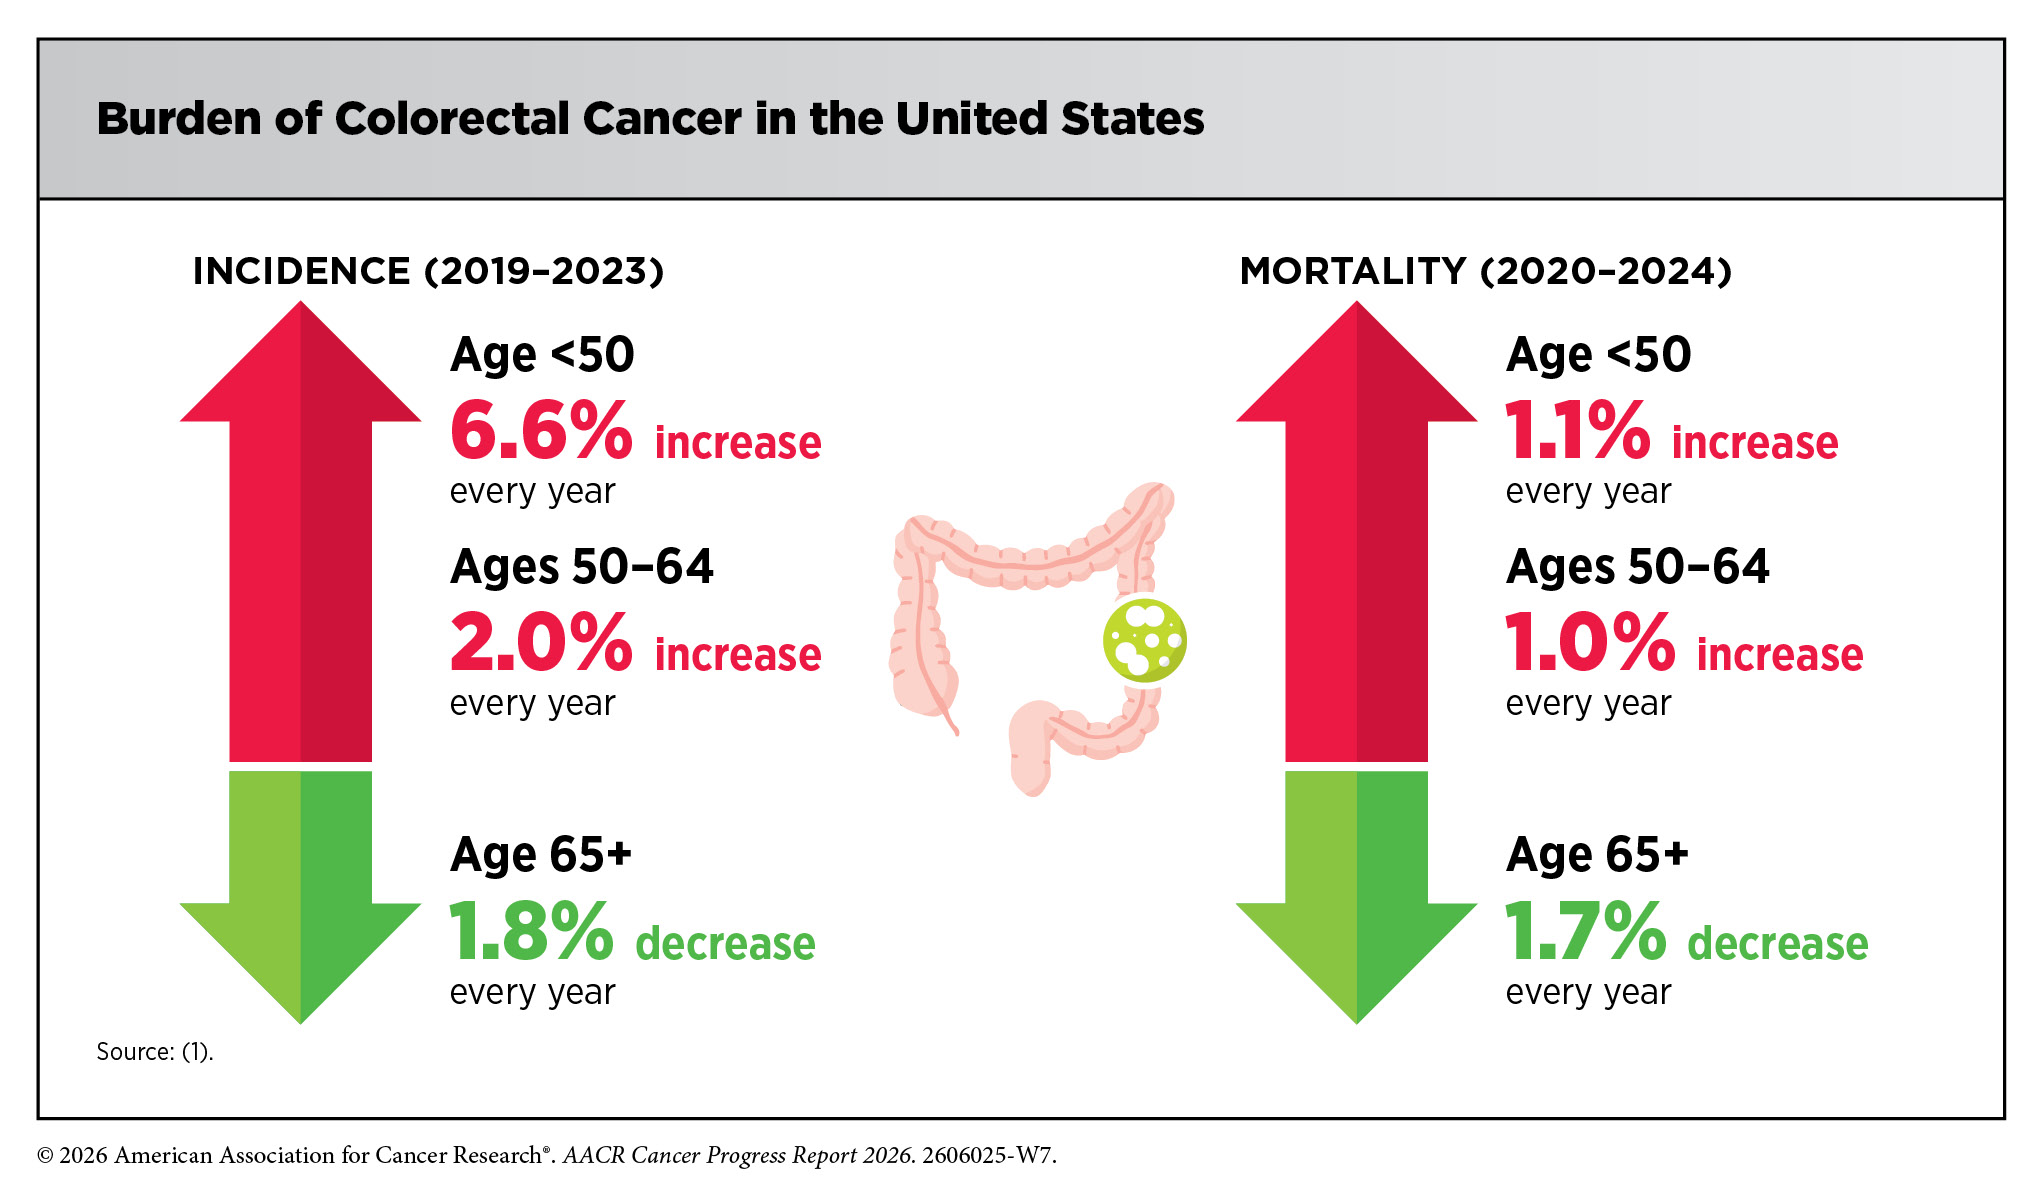
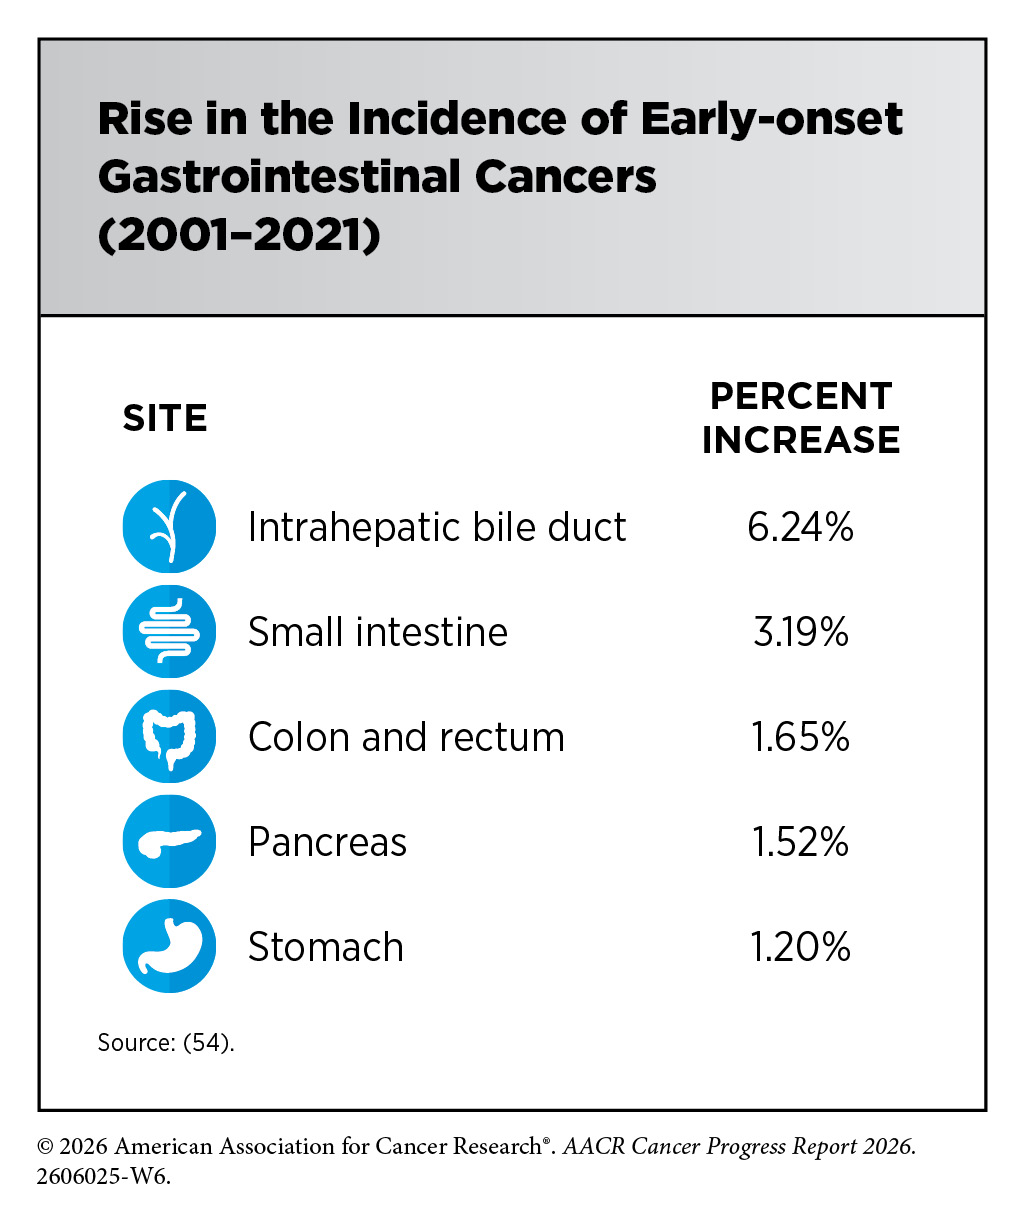
Certain cancer types have contributed disproportionately to the increase in early-onset disease. In particular, the incidence of early-onset gastrointestinal cancers, including cancers of the colorectum, stomach, and esophagus has risen substantially in the United States in recent decades (57)Chiao E, et al. (2025) Cancer Epidemiol Biomarkers Prev, 34: 1686.. These increases are thought to be driven in part by changes in population-level risk factors, including rising obesity rates, more sedentary lifestyles, greater exposure to environmental pollutants, and shifts in dietary patterns (58)Koh B, et al. (2023) JAMA Netw Open, 6: e2328171..
In response to these concerning trends, efforts to promote earlier detection and prevention have intensified. The US Preventive Services Task Force (USPSTF) has updated its screening recommendations, lowering the starting age for colorectal and breast cancer screening to 45 and 40 years, respectively, from the previous benchmark of 50 years. In parallel, researchers are evaluating emerging strategies—such as expanded genetic testing and targeted risk-based approaches—to improve prevention and early detection of CRC in younger populations (59)Chung DC, et al. (2024) N Engl J Med, 390: 973.(60)Seum T, et al. (2025) JAMA Intern Med, 185: 110..
The Global Burden of Cancer
Globally, cancer remains a leading cause of morbidity and mortality. In 2024, excluding non-melanoma skin cancers, there were an estimated 19.5 million new cancer cases and 9.7 million cancer-related deaths worldwide, with 50.7 percent of incident cases and 56.5 percent of cancer deaths occurring in Asia (61)Sung H, et al. (2026) CA: A Cancer Journal for Clinicians, 76: e70090.. Given that approximately 60 percent of the world’s population resides in Asia, these figures reflect, in part, the region’s large population base. The cancers contributing to the greatest number of new cases were lung, female breast, colorectal, prostate, and stomach cancers, accounting for 12.8 percent, 11.8 percent, 9.9 percent, 7.5 percent, and 4.7 percent of all cases, respectively. Lung cancer was also the leading cause of cancer-related death, accounting for 19.1 percent of all cancer deaths, followed by colorectal (9.4 percent), liver (7.5 percent), female breast (7.1 percent), and stomach (6.6 percent) cancers (61)Sung H, et al. (2026) CA: A Cancer Journal for Clinicians, 76: e70090..
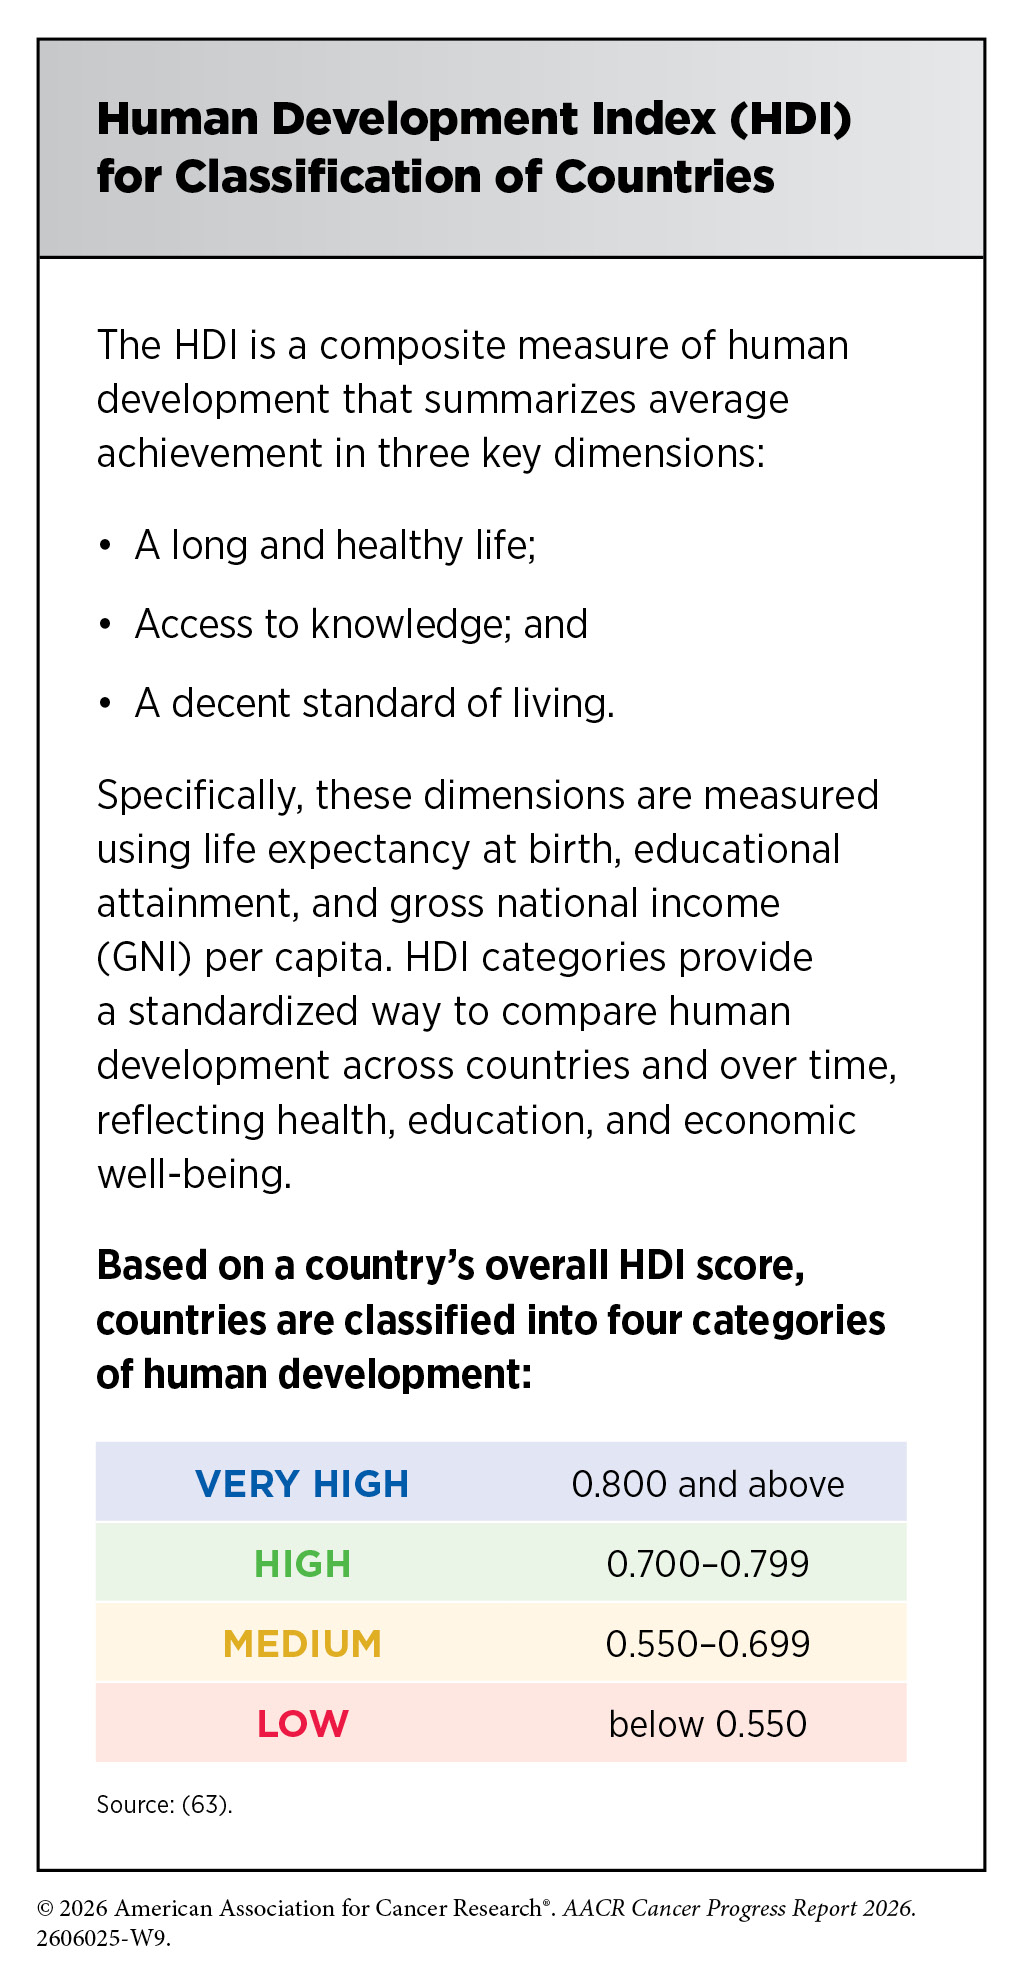
To better understand differences in cancer burden across countries, researchers often use the Human Development Index (HDI) or the World Bank classification of countries. The HDI is a measure of a country’s overall level of development based on three key areas: health, education, and standard of living—not income alone. Health is measured by life expectancy at birth, education by years of schooling, and standard of living by gross national income per person (62)United Nations Development Programme. Human Development Index (HDI). Accessed: June 30, 2026.. These indicators are combined into a single score that groups countries into different HDI levels. In contrast, the World Bank classification groups countries solely by income level. Together, these frameworks help researchers compare cancer burden across countries with differing levels of development, resources, health systems, and risk factor profiles, providing important insights into global cancer disparities and opportunities for prevention, early detection, and treatment.
Patterns of cancer incidence and mortality vary considerably across HDI categories. In 2024, female breast cancer was the most commonly diagnosed cancer across all HDI levels and in India, while lung cancer was the leading cancer diagnosis ranked first in China. Lung cancer was also the leading cause of cancer death across all HDI levels, China, and India, except in low-HDI countries, where female breast cancer was the leading cause of cancer death (61)Sung H, et al. (2026) CA: A Cancer Journal for Clinicians, 76: e70090..
While colorectal and prostate cancers are common across most HDI levels, infection-related cancers account for a larger share of the cancer burden in lower-HDI countries. Cervical cancer, largely caused by HPV infection, is the second most commonly diagnosed cancer in low-HDI countries and third in medium-HDI countries. In India, lip and oral cavity cancer ranks second for incidence and third for mortality, highlighting the country’s substantial oral cancer burden (61)Sung H, et al. (2026) CA: A Cancer Journal for Clinicians, 76: e70090..
The AACR Pediatric Cancer Progress Report 2025 highlights global trends in cancers affecting children and adolescents. Childhood cancer is a major worldwide health challenge, with the United States and other high-income countries (HICs) accounting for only 10 percent to 20 percent of cases. In contrast, approximately 80 percent to 90 percent of childhood cancers occur in low-income countries (LICs) and middle-income countries (65)Atun R, et al. (2020) Lancet Oncol, 21: e185.(66)Bhakta N, et al. (2019) Lancet Oncol, 20: e42..
Global childhood cancer patterns reveal substantial disparities in incidence and outcomes, largely influenced by differences in demographics, health care infrastructure, socioeconomic development, and timely access to diagnosis, treatment, and supportive care. For example, although treatment advances in HICs have dramatically improved survival, these gains have not been realized uniformly around the globe. While advances in HICs have achieved 5-year survival rates for childhood cancers of nearly 80 percent, survival rates in LICs and lower middle-income countries (LMICs) remain below 30 percent (67)World Health Organization. CureAll framework: WHO Global Initiative for Childhood Cancer. Increasing Access, Advancing quality, Saving lives. Accessed: June 30, 2026..
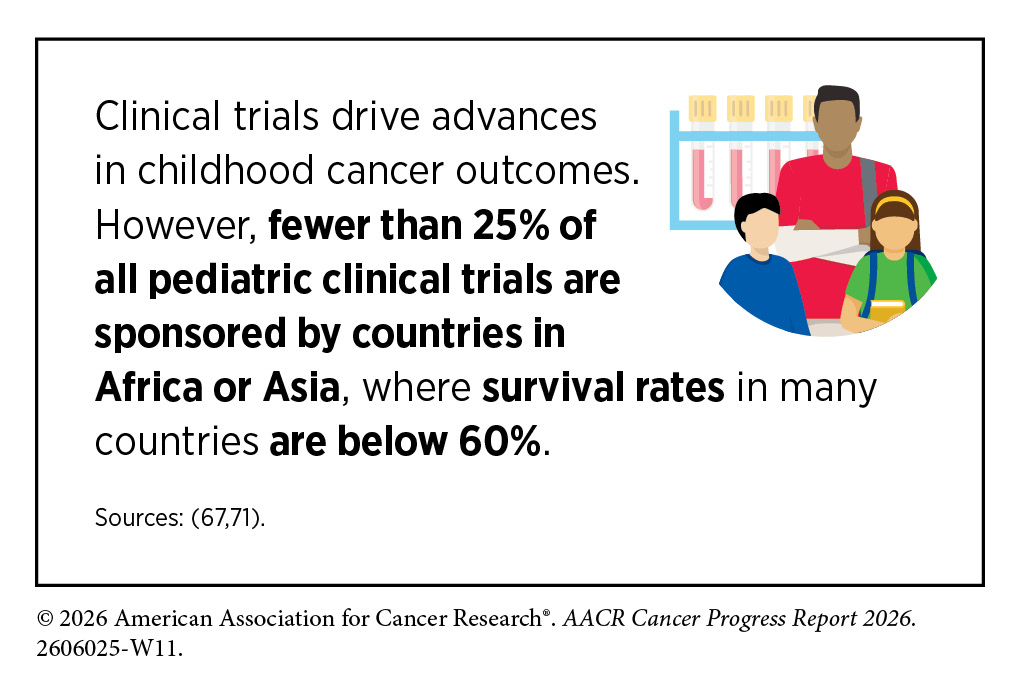
In 2025, the International Agency for Research on Cancer estimated more than 280,000 new pediatric cancer cases and nearly 108,000 deaths worldwide (68)International Agency for Research on Cancer. Cancer Tomorrow. Accessed: June 30, 2026.. However, these figures likely underestimate the true burden due to underdiagnosis and differences in data collection. Adjusted estimates suggest that the actual number of cases may be closer to 470,000, with approximately 113,000 deaths (66)Bhakta N, et al. (2019) Lancet Oncol, 20: e42.(69)Ward ZJ, et al. (2019) Lancet Oncol, 20: 483.(70)Daltveit DS, et al. (2025) JNCI: Journal of the National Cancer Institute.. Despite these limitations, available data provide critical insight into the global impact of childhood cancer.
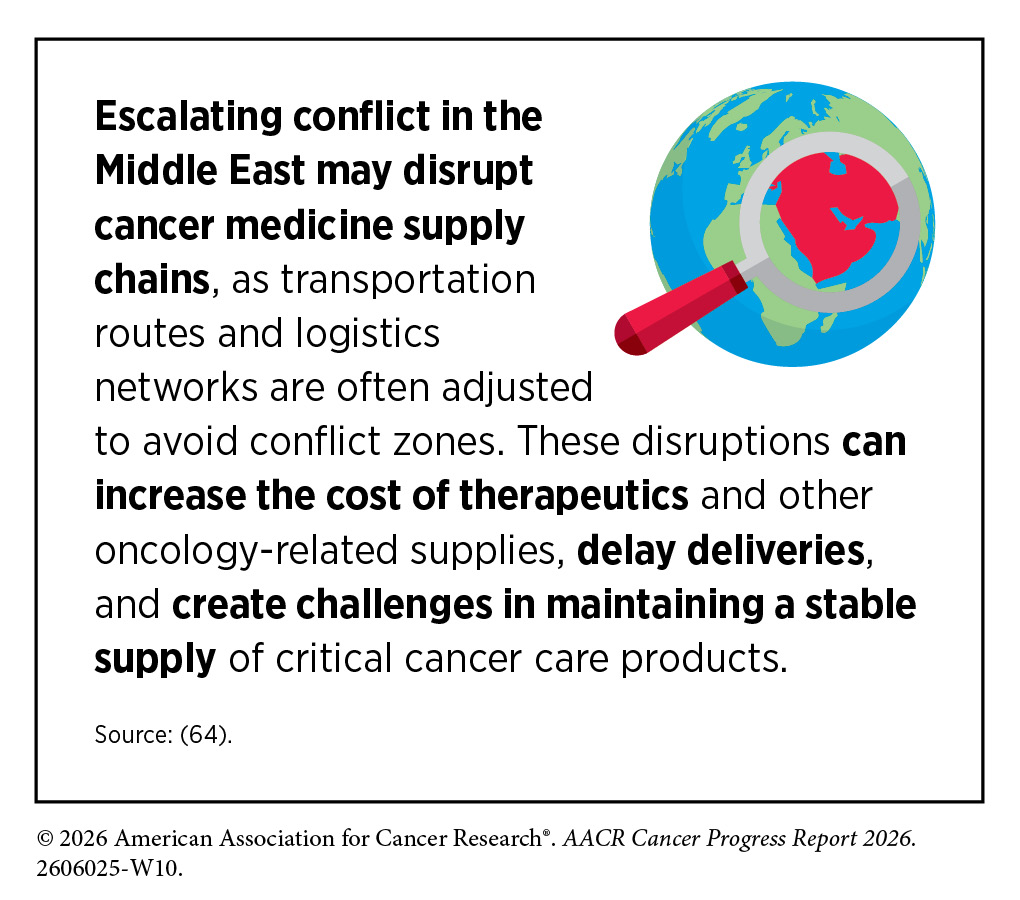
Achieving equitable progress in cancer control requires stronger global collaboration to share best practices and develop locally relevant, innovative approaches. Aligning research investment with the global distribution of cancer burden and access to care is critical, alongside priorities in low-income and middle-income settings such as earlier diagnosis, improved access and outcomes, value-based care, implementation research, capacity building, and effective use of technology (72)Jefford M, et al. (2025) Lancet Reg Health West Pac, 65: 101748.(73)Barragan-Carrillo R, et al. (2025) American Society of Clinical Oncology Educational Book, 45: e473930.. Efforts should focus on preventing and treating infection-related cancers and expanding access to surgery and radiotherapy, which are critical for treating many solid tumors (74)Al Sukhun SA, et al. (2024) JCO Glob Oncol, 10: e2400015.(75)McIntosh SA, et al. (2023) Lancet Oncol, 24: 636..
Funding Cancer Research: A Vital Investment
The immense toll of cancer is felt both in the number of lives it affects each year and its economic impact. The direct costs of cancer care, which include the cost of medical care and other services directly related to a cancer diagnosis, are just one measure of the financial impact of cancer. In the United States, direct costs associated with cancer care in 2020 were estimated to be $236.2 billion (in 2022 dollars), corresponding to approximately $129,500 per cancer diagnosis (76)Ngo P, et al. (2026) J Natl Cancer Inst Monogr, 2026: 3.. These costs are expected to rise as the US population grows and ages, with cancer-related medical costs in the United States projected to exceed $245 billion by 2030 (77)Mariotto AB, et al. (2020) Cancer Epidemiol Biomarkers Prev, 29: 1304..
Notably, direct medical costs do not include the additional burden of lost productivity due to cancer-related illness and premature death. Globally, premature cancer-related deaths among people ages 15 to 64 in 2022 were estimated to cost $566 billion in lost productivity, reflecting losses from paid work as well as unpaid activities such as caregiving, household responsibilities, and other contributions to families and communities (78)Kong YC, et al. (2025) J Natl Cancer Inst, 117: 2612.. These productivity losses may be especially pronounced among those diagnosed at younger ages, for whom cancer can disrupt education, employment, and long-term earning potential (see Childhood Cancer Survivors and Adolescent and Young Adult Cancer Survivors). For example, in the United States, lifetime productivity losses among adolescents and young adults diagnosed with cancer in 2019 were estimated at $18 billion, with the majority of these losses attributable to premature mortality and reduced workforce participation (79)Parsons SK, et al. (2023) J Clin Oncol, 41: 3260..
Individuals with cancer shoulder a large amount of the economic burden associated with cancer care (see Financial Challenges). In 2019, the national patient economic burden associated with cancer care was estimated to be $21.1 billion, including $16.2 billion in out-of-pocket costs for cancer-related medical care and $4.9 billion in time costs, reflecting the value of time that patients spent traveling to and from health care, waiting for care, and receiving care (15)American Cancer Society. Cancer Facts and Figures 2026. Accessed: June 30, 2026.(80)Yabroff KR, et al. (2021) J Natl Cancer Inst, 113: 1670..
With the number of new cancer cases projected to increase in the coming decades, both direct and indirect costs of cancer care are expected to rise substantially. One analysis estimated that cancer will cost the US economy $5.3 trillion over the next three decades (81)Chen S, et al. (2023) JAMA Oncol, 9: 465.. This rising economic toll underscores the urgent need for sustained investment in cancer research to accelerate progress across the cancer continuum and reduce the growing burden of cancer on patients, families, the health care system, and the broader economy.
As the burden of cancer continues to grow, federal research funding should be strategically aligned with areas of greatest clinical need. However, a recent analysis of nine major cancer types in the United States found that several highly lethal cancers, including cancers of the pancreas, liver, lung, and stomach, received disproportionately low funding from the National Institutes of Health (NIH) in fiscal year (FY) 2025 relative to their estimated mortality burden (82)Mohindroo C, et al. (2026) JAMA Netw Open, 9: e267837.. Better alignment of federal research funding with areas of greatest unmet need could help accelerate progress against the most lethal cancers.
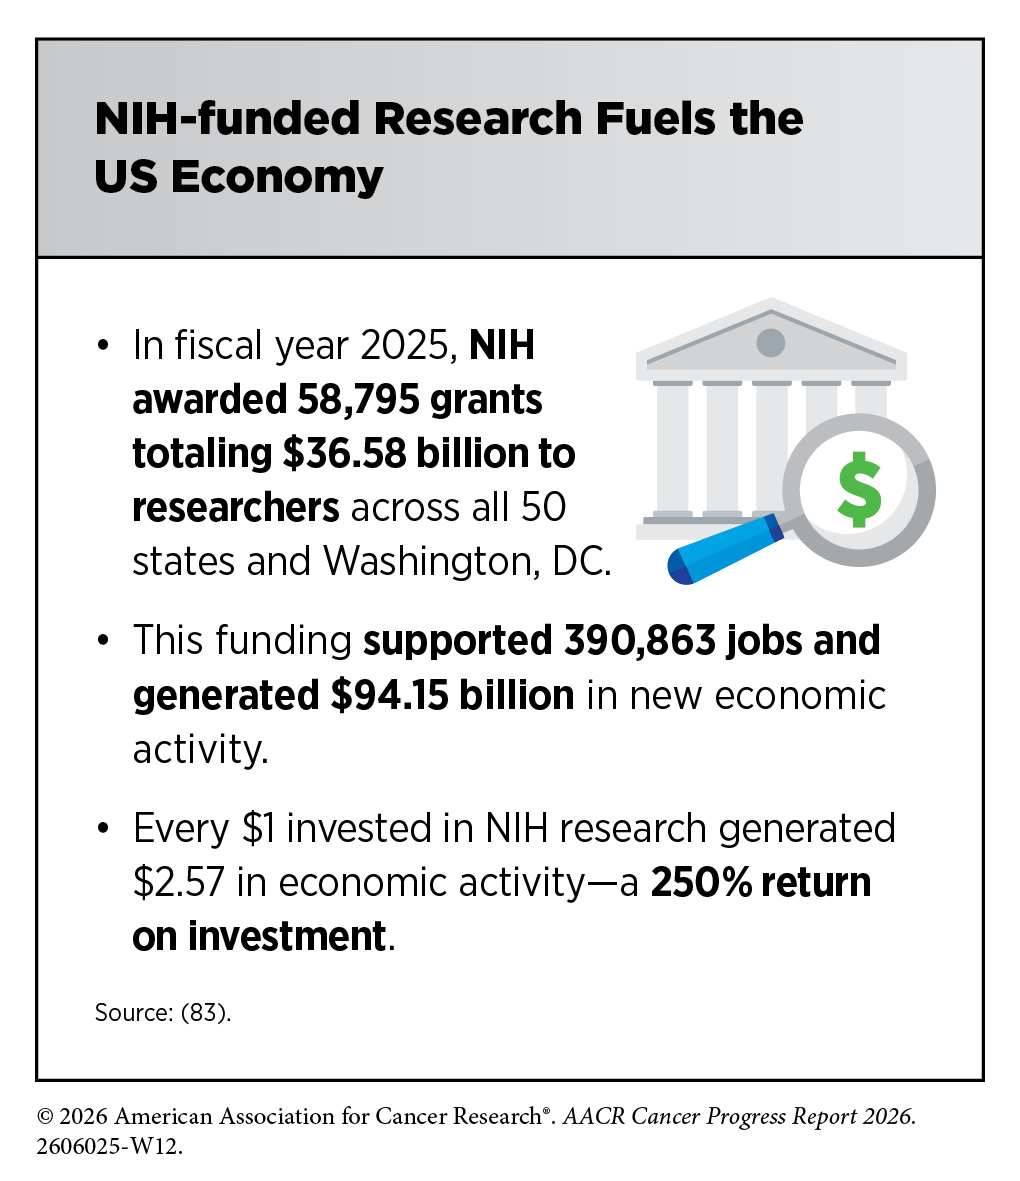
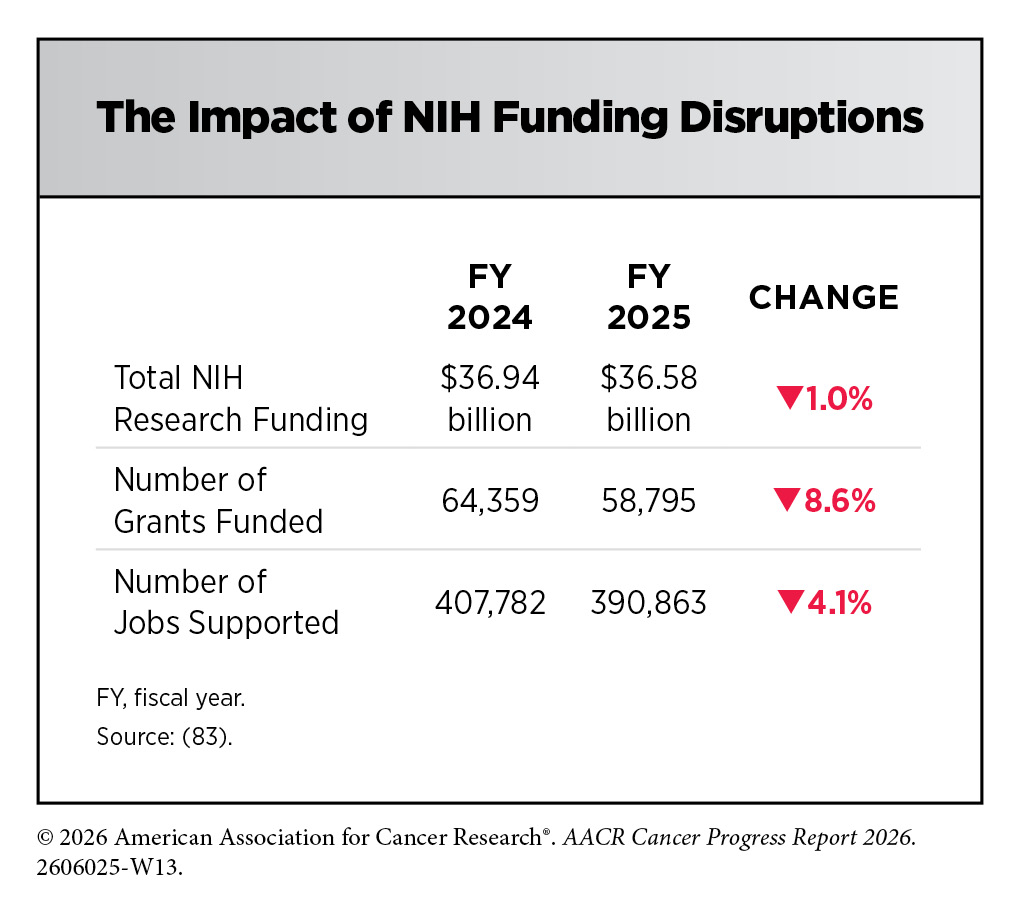
As the world’s largest funder of medical research, NIH has long received bipartisan support from US lawmakers. For most of the past decade, consecutive budget increases have helped maintain the momentum of progress against cancer and other diseases. However, in FY 2024, NIH funding declined for the first time in nearly a decade and remained flat in FY 2025, marking 2 consecutive years without an increase in the agency’s budget. At the same time, the cost of conducting medical research continues to rise because of inflation and other economic factors, as well as the increasing complexity of scientific investigations and clinical trials, which often require advanced technologies and highly specialized personnel. Although in FY 2026 NIH received a modest funding increase of approximately 1 percent over FY 2025 levels, this increase is unlikely to keep pace with rising research costs, potentially limiting the nation’s capacity to support the full spectrum of research that drives advances in cancer prevention, early detection, treatment, and survivorship.
The medical research community also continues to face disruptions to previously awarded NIH funding. In early 2025, the Administration terminated support for more than 2,200 active NIH research grants and withdrew billions of dollars in previously awarded research funding (84)Association of American Medical Colleges. Impact of NIH Grant Terminations. Accessed: June 30, 2026.. Training and career development programs were particularly affected, with hundreds of canceled awards intended to support graduate students, postdoctoral fellows, and early-career investigators (84)Association of American Medical Colleges. Impact of NIH Grant Terminations. Accessed: June 30, 2026.(85)Oliveira DFM, et al. (2026) Proc Natl Acad Sci U S A, 123: e2527755123.. NIH grant terminations also disrupted hundreds of active clinical trials, including cancer-related trials, affecting more than 74,000 trial participants (86)Patel VR, et al. (2026) JAMA Intern Med, 186: 126.. The effects of these funding losses continue to reverberate across the medical research enterprise, threatening scientific progress, weakening the research pipeline, and delaying discoveries that could improve outcomes for patients with cancer and other diseases.
Compounding these challenges, in April 2026, the White House released the President’s FY 2027 budget request, which proposed a $5 billion reduction in overall NIH funding compared to FY 2026 enacted levels (87)US Department of Human and Health Services. Budget in Brief. Fiscal Year 2027. Accessed: June 30, 2026.. These proposed reductions come at a time when other nations are rapidly expanding their cancer research and drug development capacity, with some now outpacing the United States in high-quality cancer research output and oncology clinical trial initiation (88)Nature, 640: S65.(89)Kang SY, et al. (2026) JAMA, 335: 1355.(90)Plackett B (2025) Nature, 640: S58.. Without strong federal support for medical research, the United States risks losing its position as a global leader in scientific discovery, innovation, and the development of lifesaving cancer treatments.
Discoveries fueled by NIH funding have transformed cancer prevention, detection, and treatment, turning a once-fatal diagnosis into a manageable chronic condition for many patients, saving millions of lives and offering hope to millions more. Sustained and predictable federal funding is essential to preserve US leadership in medical research, safeguard progress against cancer, support the development of the next generation of cancer researchers, and ensure that future generations continue to benefit from scientific breakthroughs in the quest to end cancer (see AACR Call to Action).
Next Section: Understanding the Path to Cancer Development Previous Section: Snapshot of a Year of Progress