- Cancer Disparities Experienced by US Racial and Ethnic Minority Populations
- American Indian or Alaska Native (AIAN) Population
- Asian Population
- Black Population
- Hispanic Population
- Native Hawaiian or Pacific Islander (NHPI) Population
- Cancer Disparities Experienced by Other Medically Underserved Populations
- Populations Residing in Rural Areas
- Populations Living in Persistent-poverty Areas
- Populations Identifying as Sexual and Gender Minority
- Achieving Health Equity: A Vital Investment for the US Public Health and Economy
The State of US Cancer Disparities in 2026
In this section, you will learn:
- Cancer disparities are adverse differences in the cancer burden that are experienced by, but not limited to, racial and ethnic minority groups, rural residents, those belonging to the sexual and gender minority community, and those living in persistent-poverty areas.
- In recent decades, disparities in the burden of certain cancer types have declined among racial and ethnic minority populations.
- From 1991 through 2024, overall cancer mortality among Black men declined by more than 50 percent, the largest decline of any racial and ethnic group. This progress is largely driven by reductions in smoking initiation, advances in treatment, and earlier detections for some cancers.
- Over the past two decades, gaps have narrowed significantly in cervical cancer mortality between Hispanic and White populations, and in stomach cancer mortality between Asian or Pacific Islander and White populations.
- Despite some progress, substantial differences in cancer burden remain. Key partners across the cancer care continuum are working together to understand and reduce cancer disparities.
- Research reveals that the aggregated cancer data available in most cancer registries and databases mask underlying cancer disparities within subgroups of racial or ethnic populations, necessitating the collection of disaggregated data.
- The cost of racial and ethnic health disparities, including cancer disparities, to the US economy in 2018 alone was $451 billion, with a disproportionate share of this burden borne by Black populations.
Contents
Remarkable advances in cancer prevention, early detection, treatment, and survivorship care have accelerated the pace of progress against cancer in recent decades. From 1991 through 2024, the overall cancer death rate in the United States (US) declined by 35 percent, translating to an estimated 4.8 million fewer cancer deaths (1)Siegel RL, et al. (2026) CA Cancer J Clin, 76: e70043. (2)SEER*Explorer: An interactive website for SEER cancer statistics [Internet]. Surveillance Research Program, National Cancer Institute; 2026 Apr 22. [cited 2026 May 11]. Data source(s): SEER Incidence Data, November 2025 Submission (1975-2023), SEER 21 registries. . Over the same period, the number of individuals living with a history of cancer diagnosis more than doubled, increasing from 7.2 million in 1992 to more than 18.6 million in 2025 (3)Hewitt M, et al. (1999) J Natl Cancer Inst, 91: 1480. (4)Wagle NS, et al. (2025) CA Cancer J Clin, 75: 308. . Despite the overall progress against cancer, substantial challenges remain.
Cancer disparities are among the most pressing public health challenges in the United States. According to the National Cancer Institute (NCI), cancer disparities are adverse differences between certain population groups in cancer-related measures, including the number of new cases, the number of cancer deaths, screening rates, stage at diagnosis, cancer-related health complications, and survivorship and quality of life after treatment (5)National Cancer Institute. Cancer Disparities. Accessed: March 31, 2026. . Cancer disparities persist, and may worsen, when advances in cancer research, medical care, and health policy are not implemented equitably across population groups.
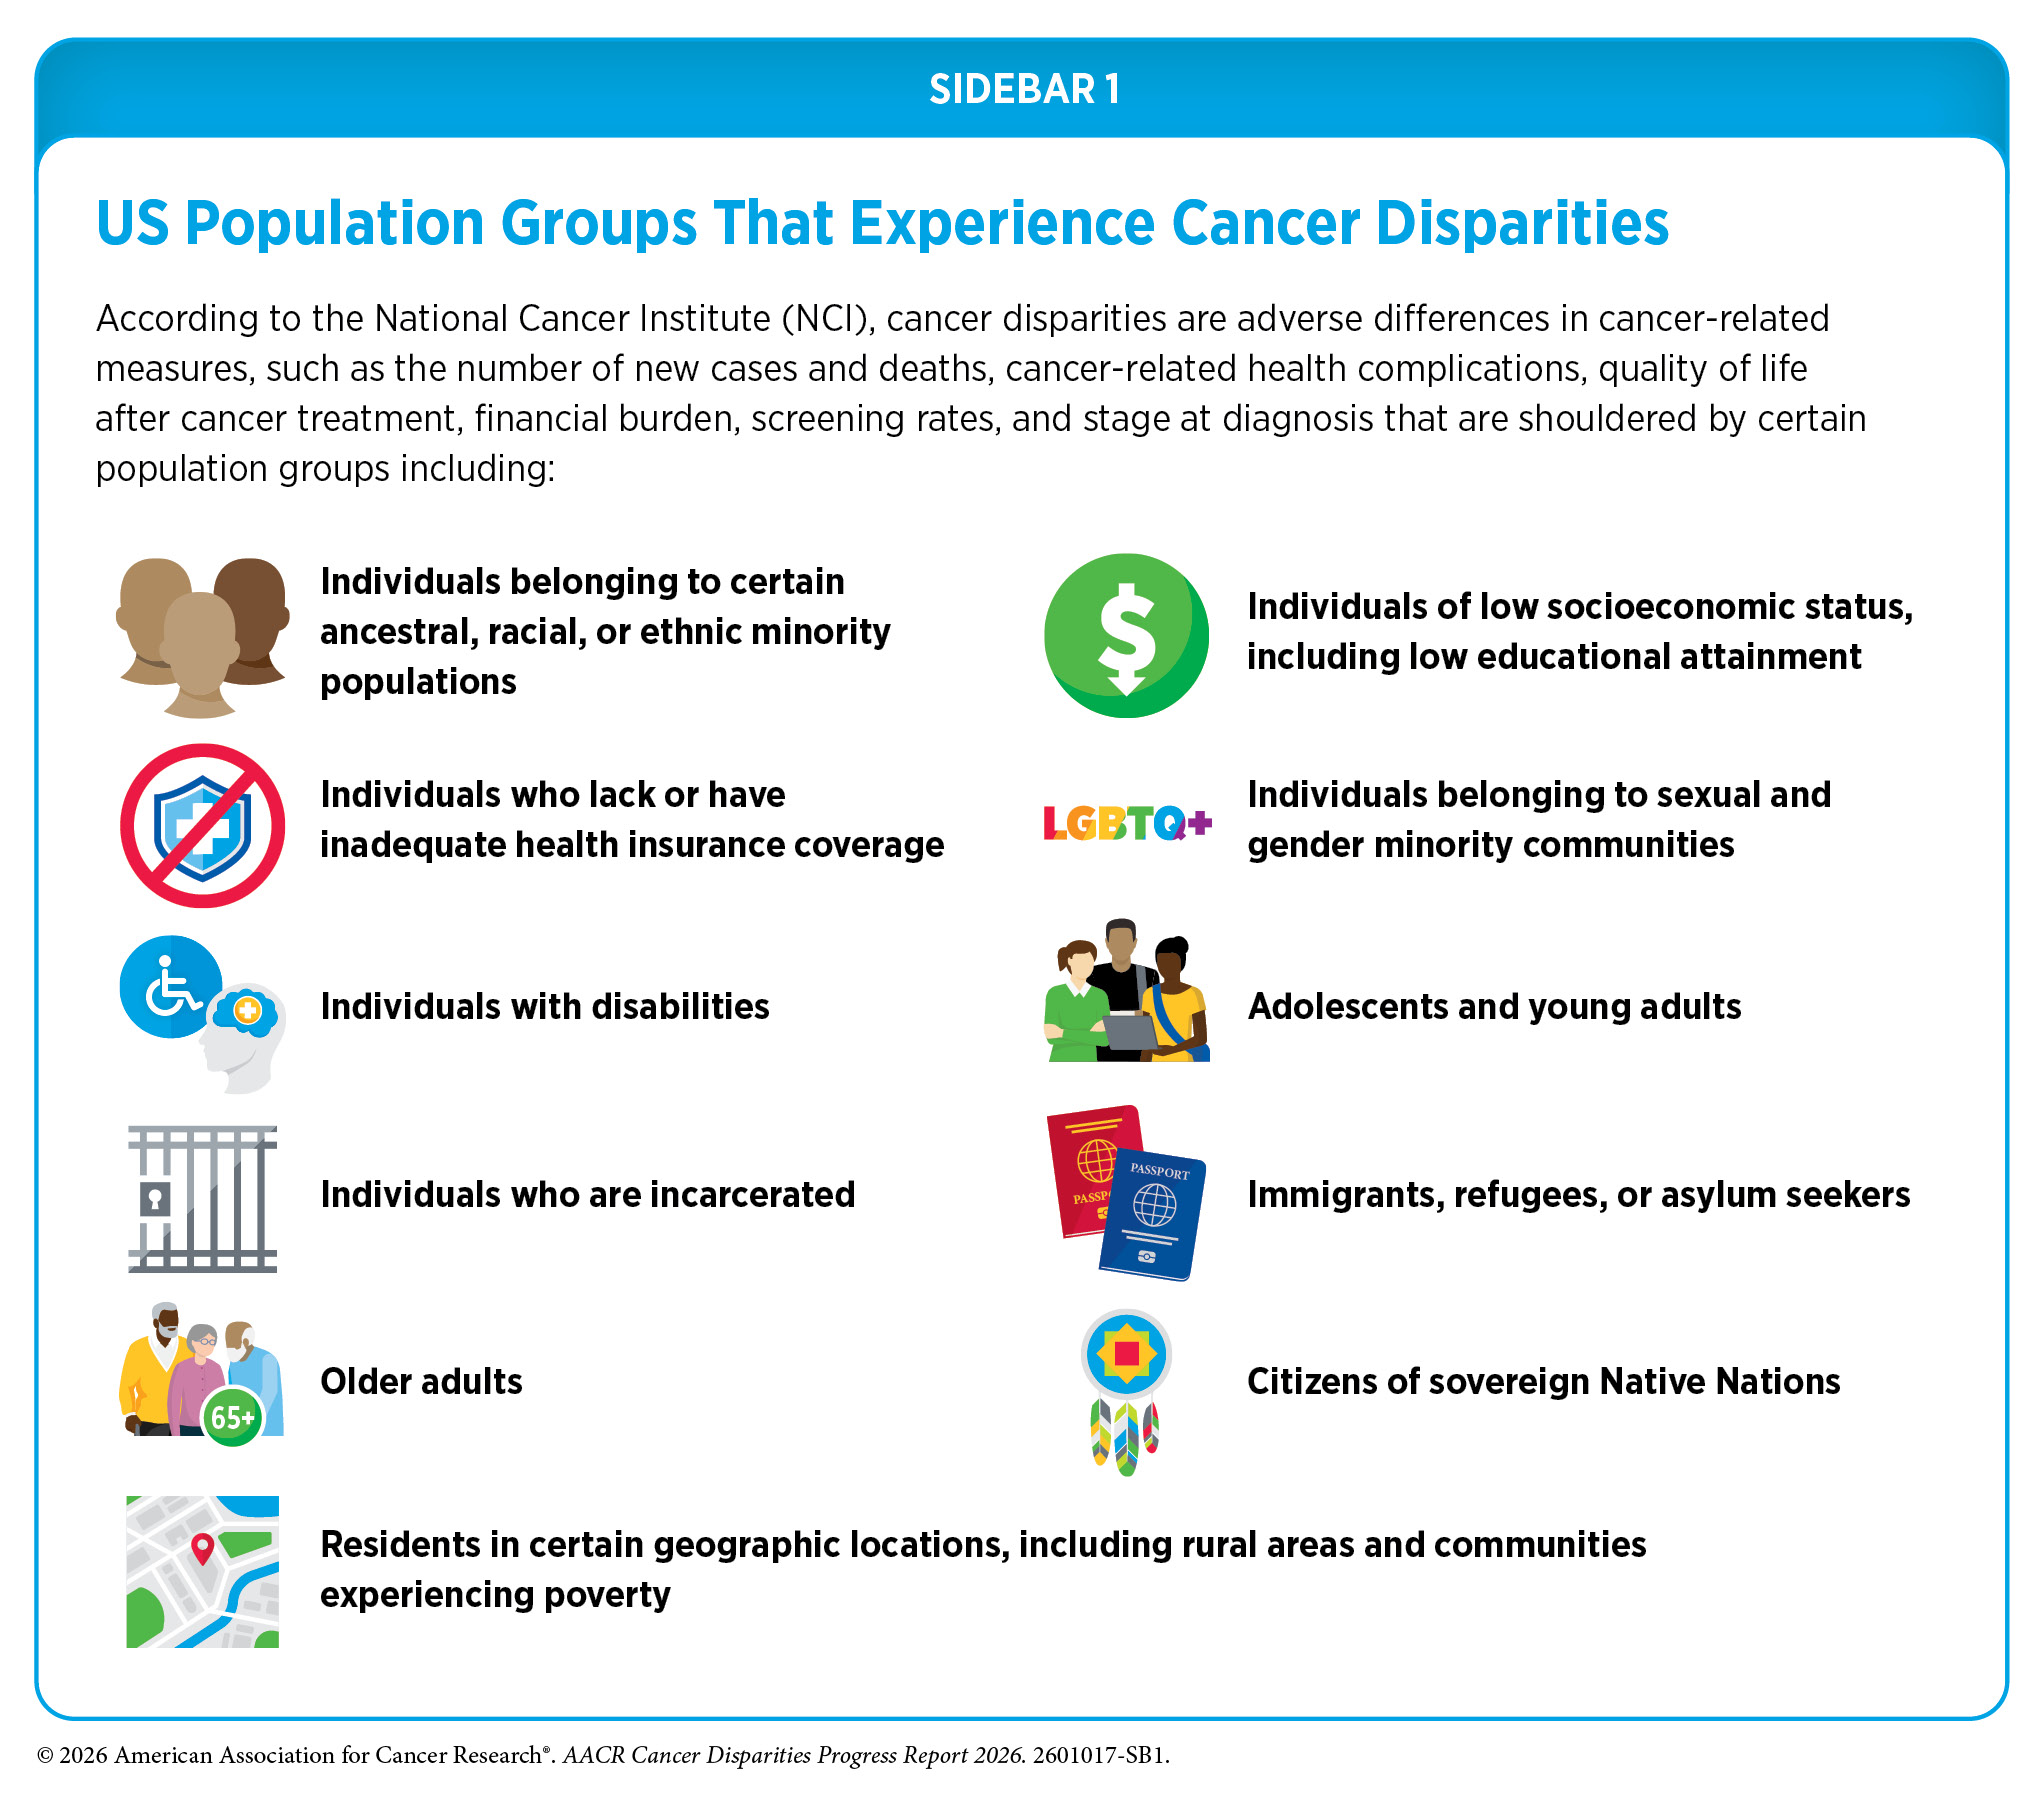
As a result of long-standing structural, social, environmental, and economic disadvantages, certain population groups continue to experience a disproportionate burden of cancer. In the United States, a long history of racism, segregation, and discrimination against marginalized population groups has resulted in structural inequities and societal injustices that cause and perpetuate many of the cancer disparities discussed in this report. Population groups that experience cancer disparities may be characterized by race, ethnicity, sex, disability status, sexual orientation, gender identity, geographic residence, income, education, and other characteristics (see Sidebar 1), and disparities may be further compounded among individuals at the intersections of multiple minoritized identities.
Cancer Disparities Experienced by US Racial and Ethnic Minority Populations
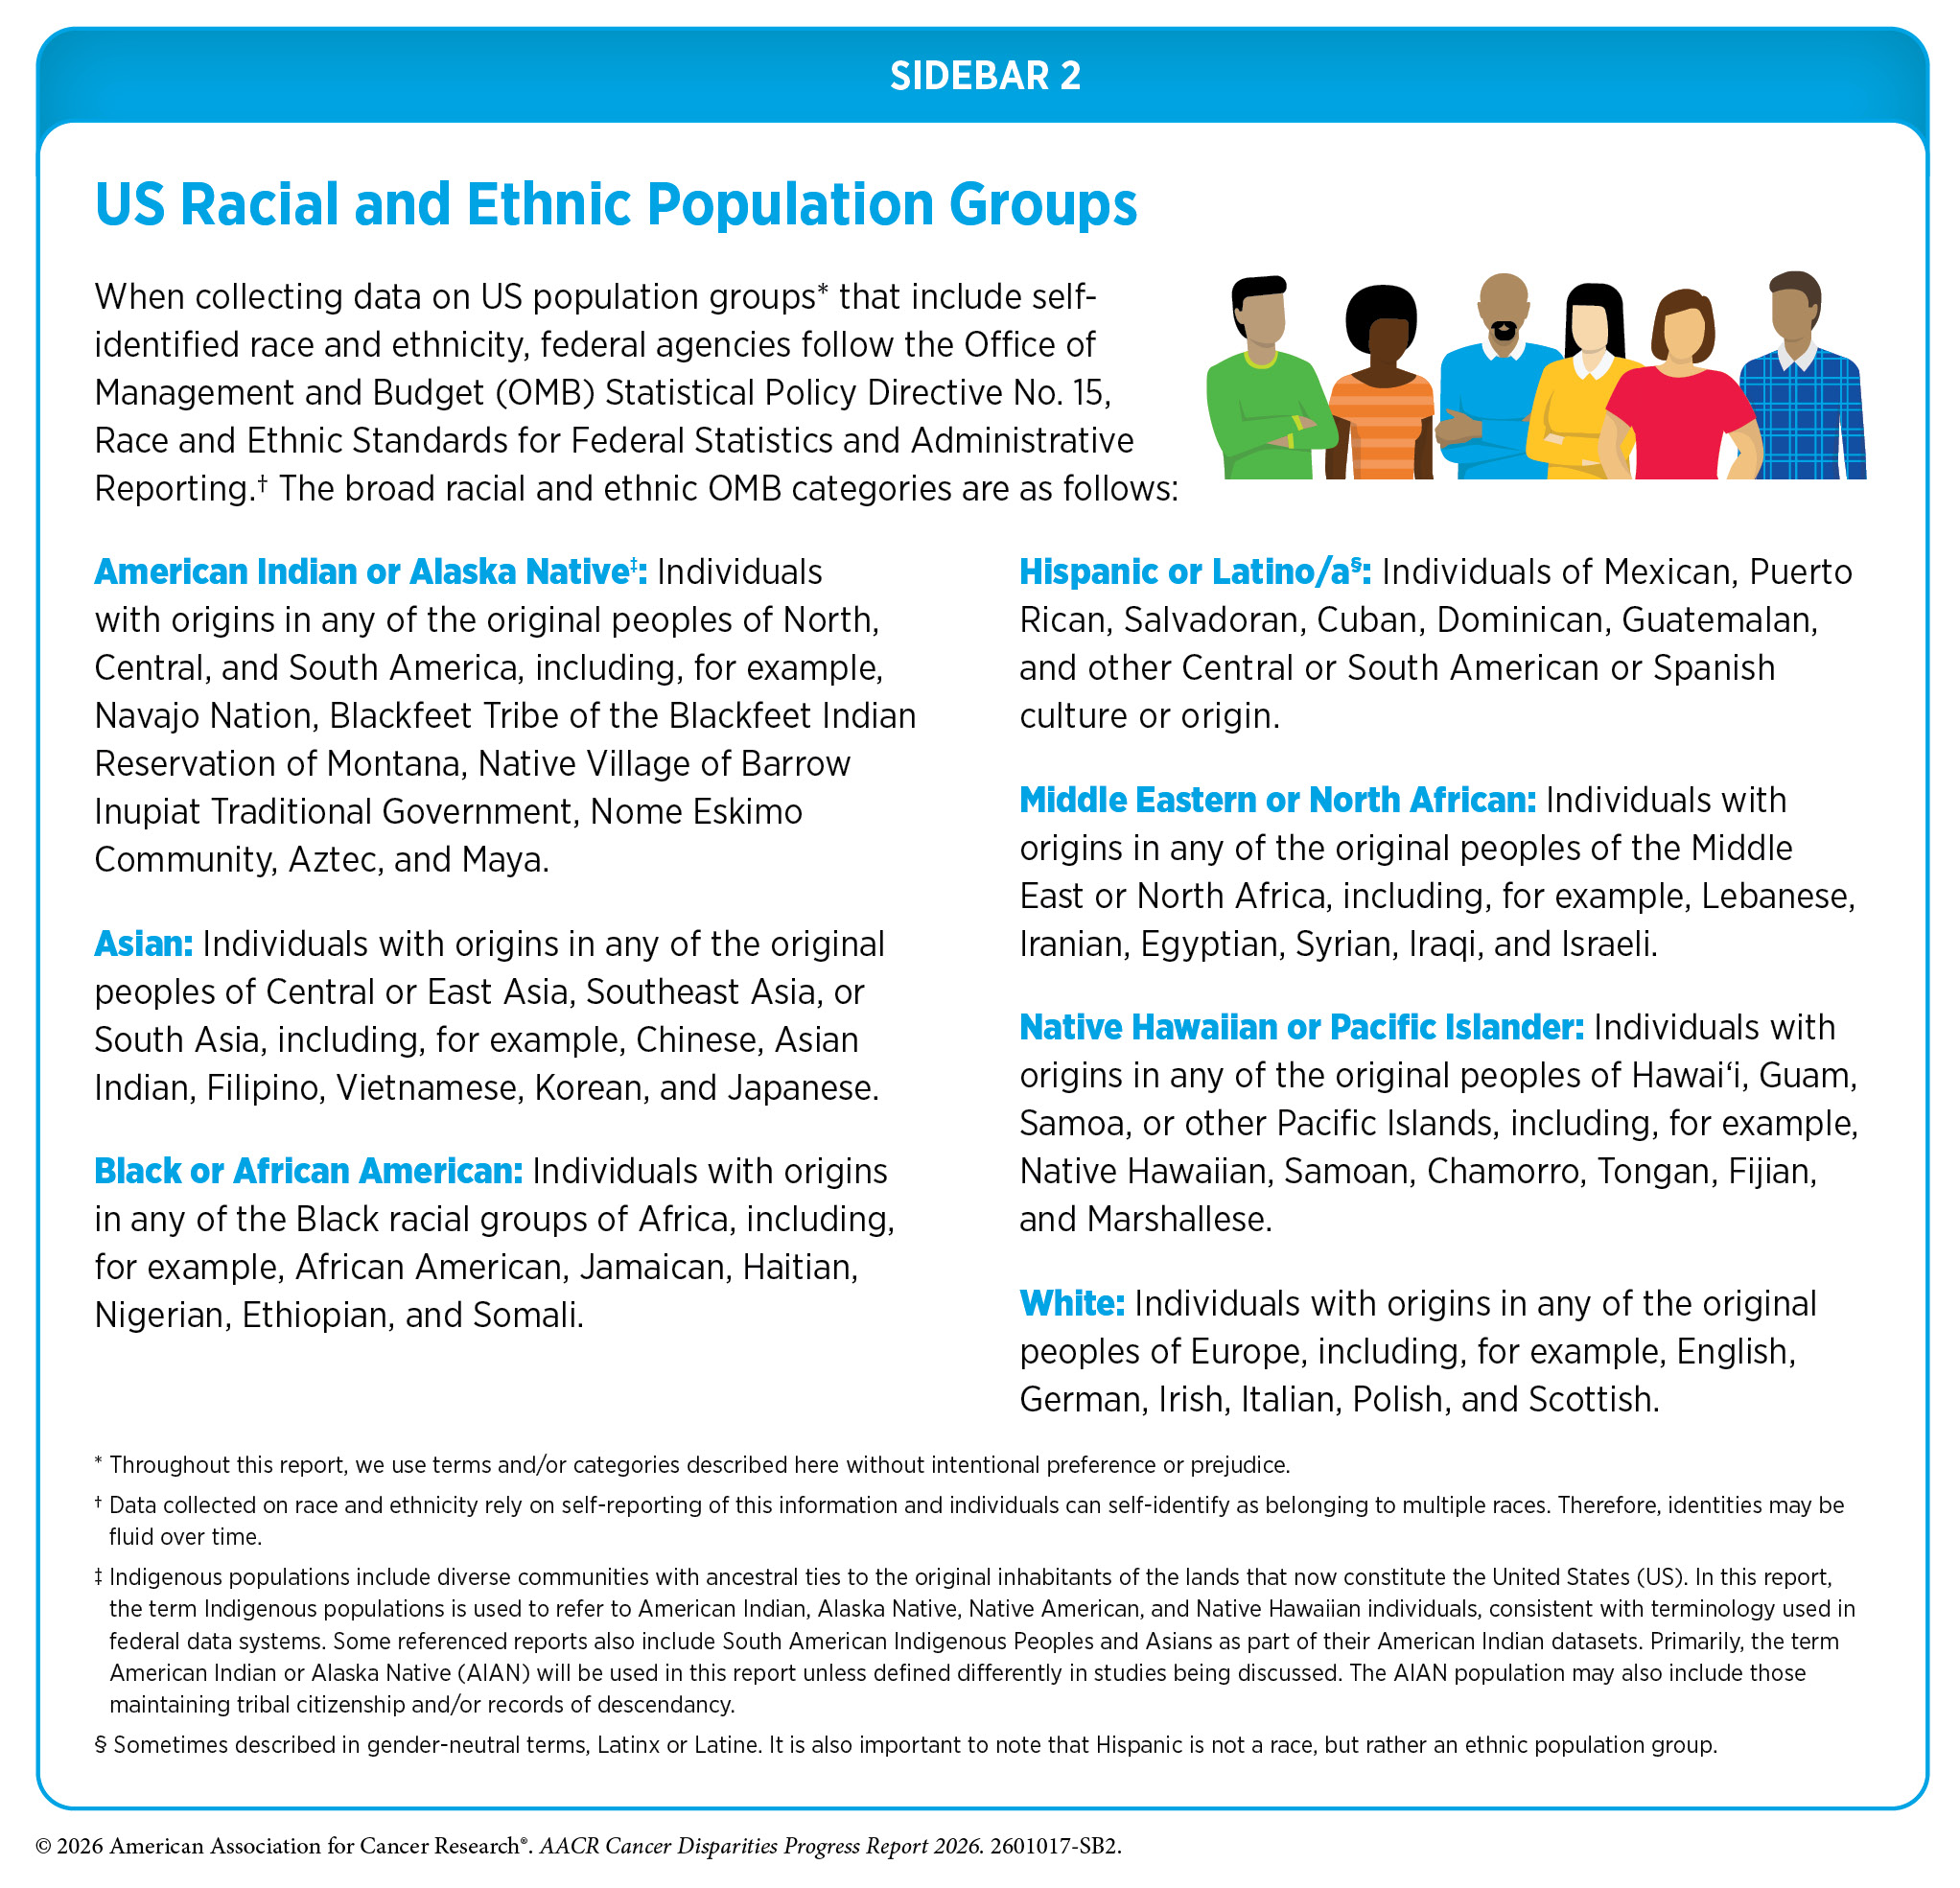
According to the 2020 Census, individuals from racial and ethnic minority groups make up more than 40 percent of the US population (see Sidebar 2). This increasing diversity is particularly important given projections that racial and ethnic minority populations will constitute the majority of the US population by 2045 (6)US Department of Commerce, Economics and Statistics Administration. Demographic turning points for the United States: Population projections for 2020 to 2060. Accessed: March 31, 2026.. As highlighted throughout this report, racial and ethnic minority populations experience varying degrees of cancer disparities.
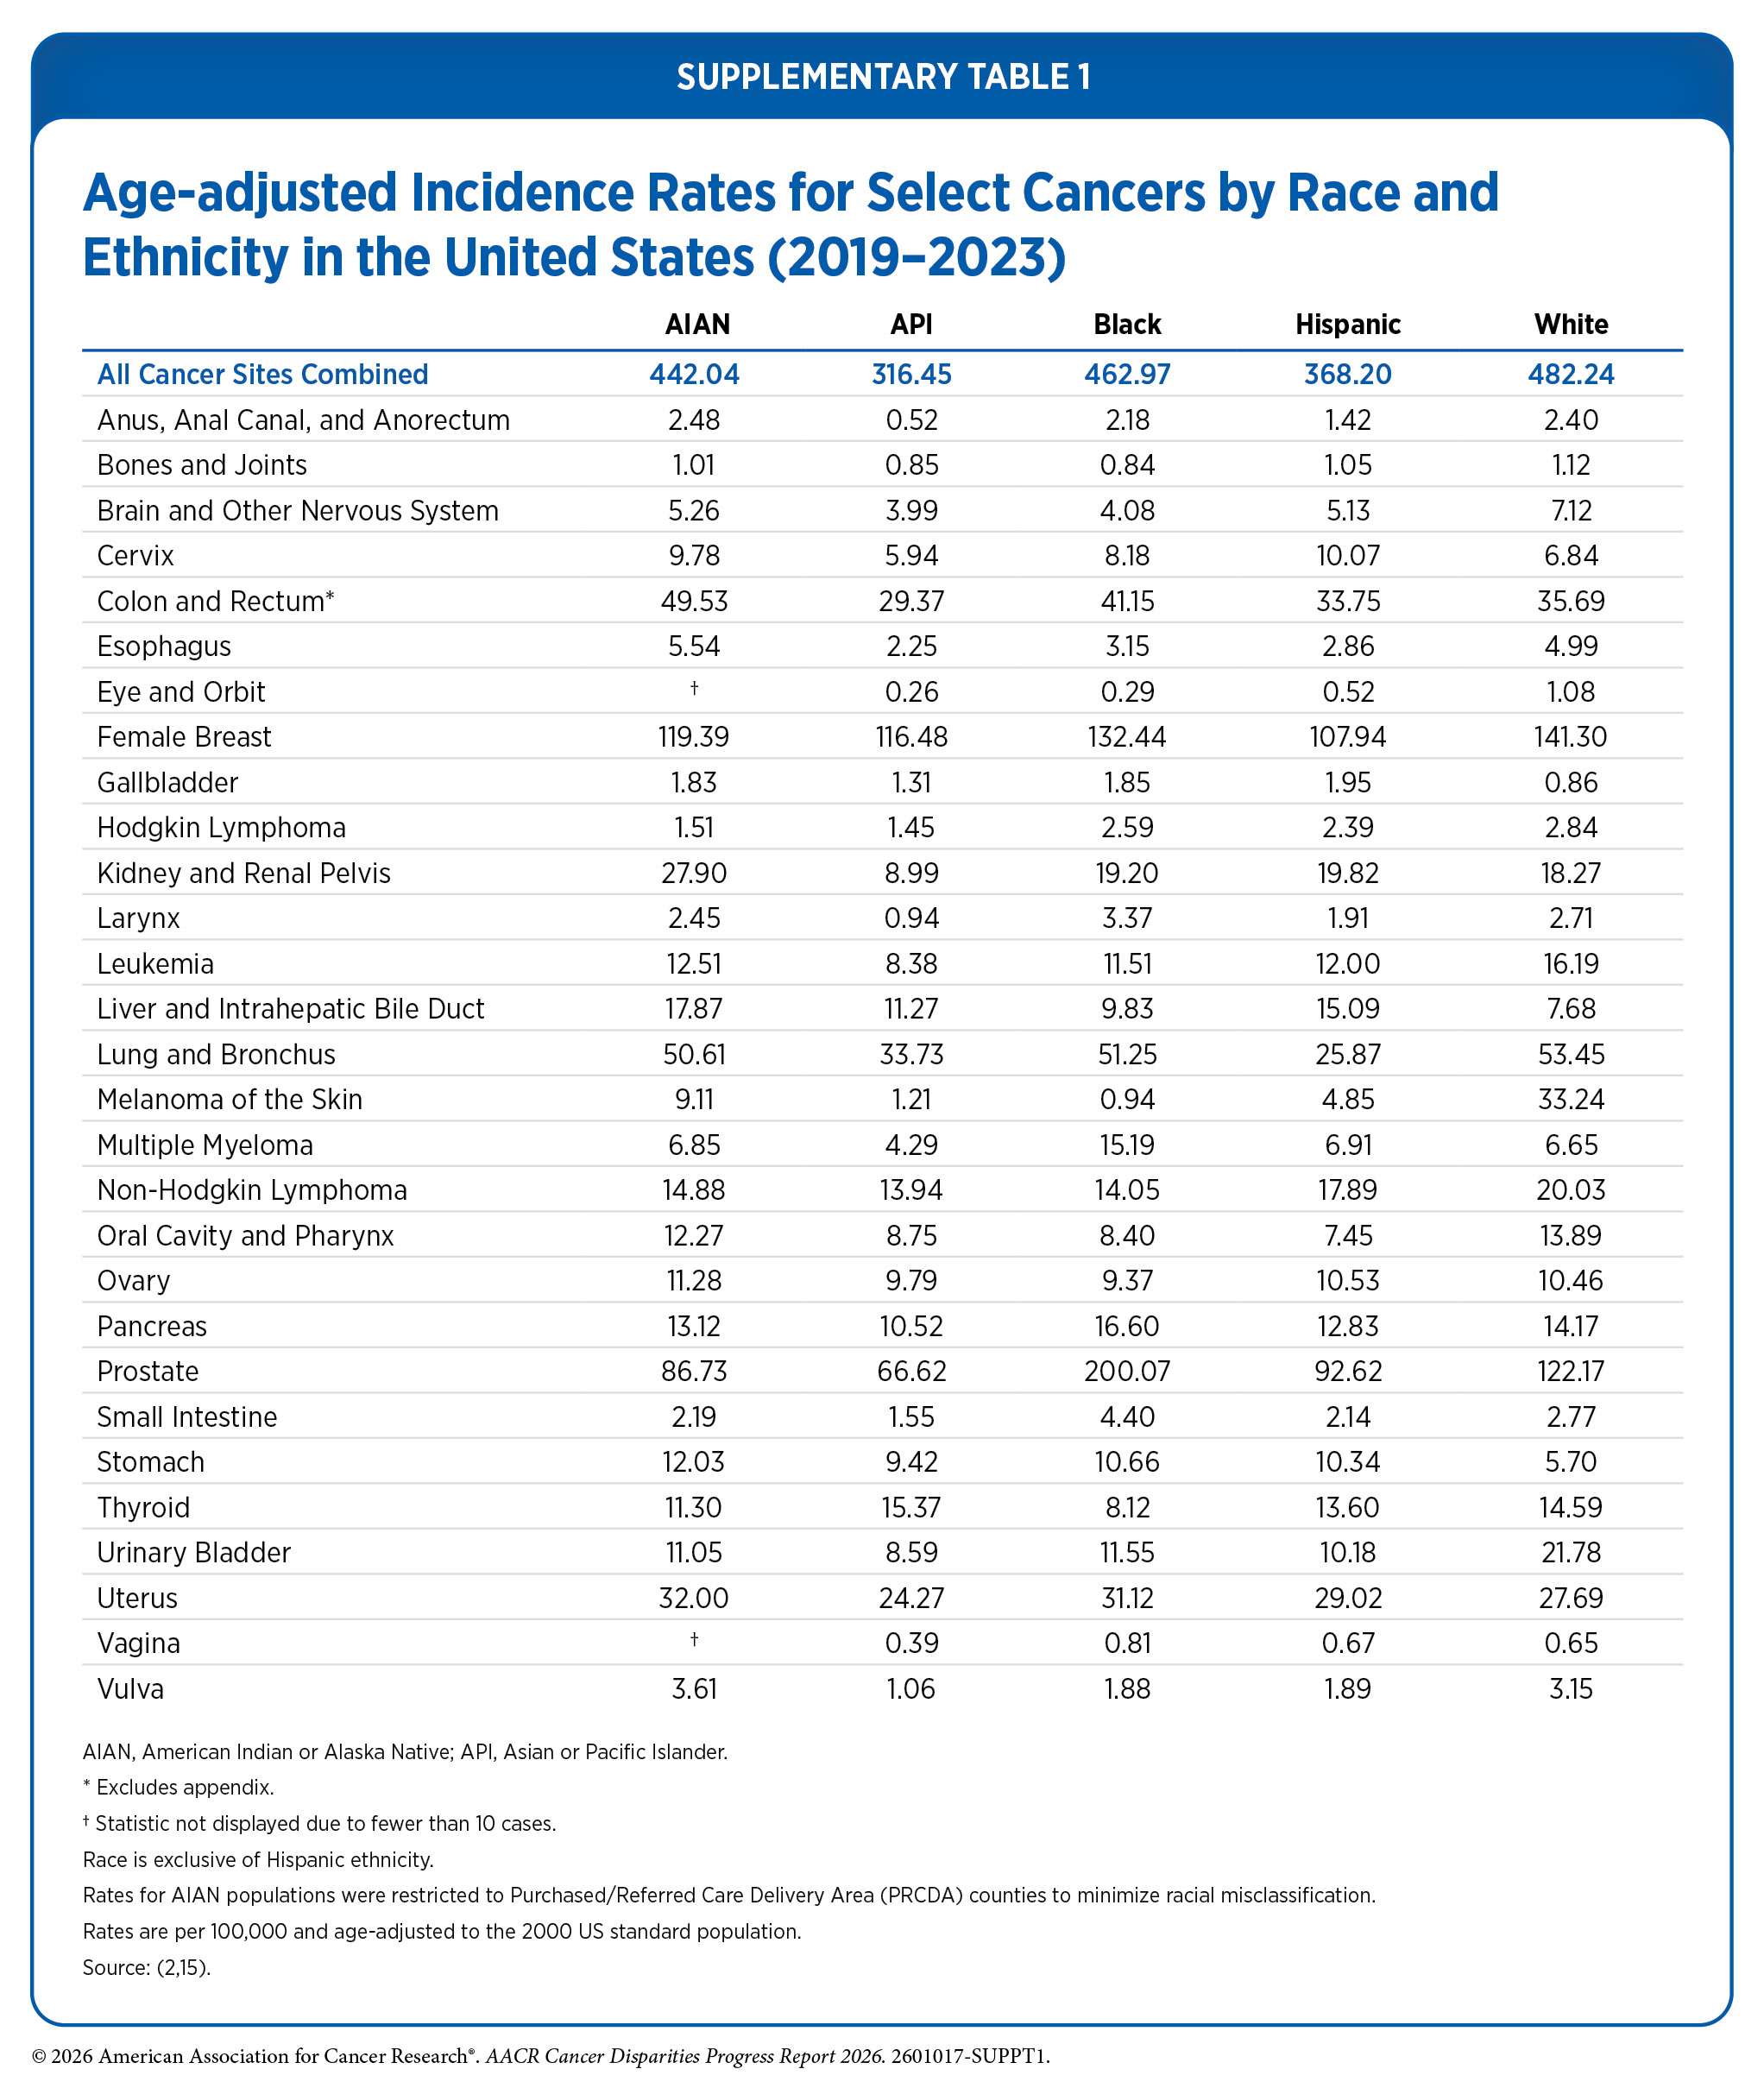
From 2019 to 2023, incidence rates for all cancers combined were higher among Black men and American Indian or Alaska Native (AIAN) women, compared to their White counterparts (2)SEER*Explorer: An interactive website for SEER cancer statistics [Internet]. Surveillance Research Program, National Cancer Institute; 2026 Apr 22. [cited 2026 May 11]. Data source(s): SEER Incidence Data, November 2025 Submission (1975-2023), SEER 21 registries. . Disparities are also evident for specific cancers. For example, cervical cancer incidence was highest among AIAN and Hispanic women, and liver cancer incidence was higher among Asian or Pacific Islander (API) populations compared to White individuals (see Table 1 and Supplementary Table 1). Similarly, during 2020–2024, overall cancer mortality rates were higher among Black and AIAN populations compared to White individuals (see Table 1 and Supplementary Table 2). Additionally, during 2016–2022, 5-year relative survival was lower among all racial and ethnic minority groups compared to White individuals (7)SEER*Stat Database: Mortality – All COD, Aggregated With State, Total U.S. (1990-2023) , National Cancer Institute, DCCPS, Surveillance Research Program, released February 2025..
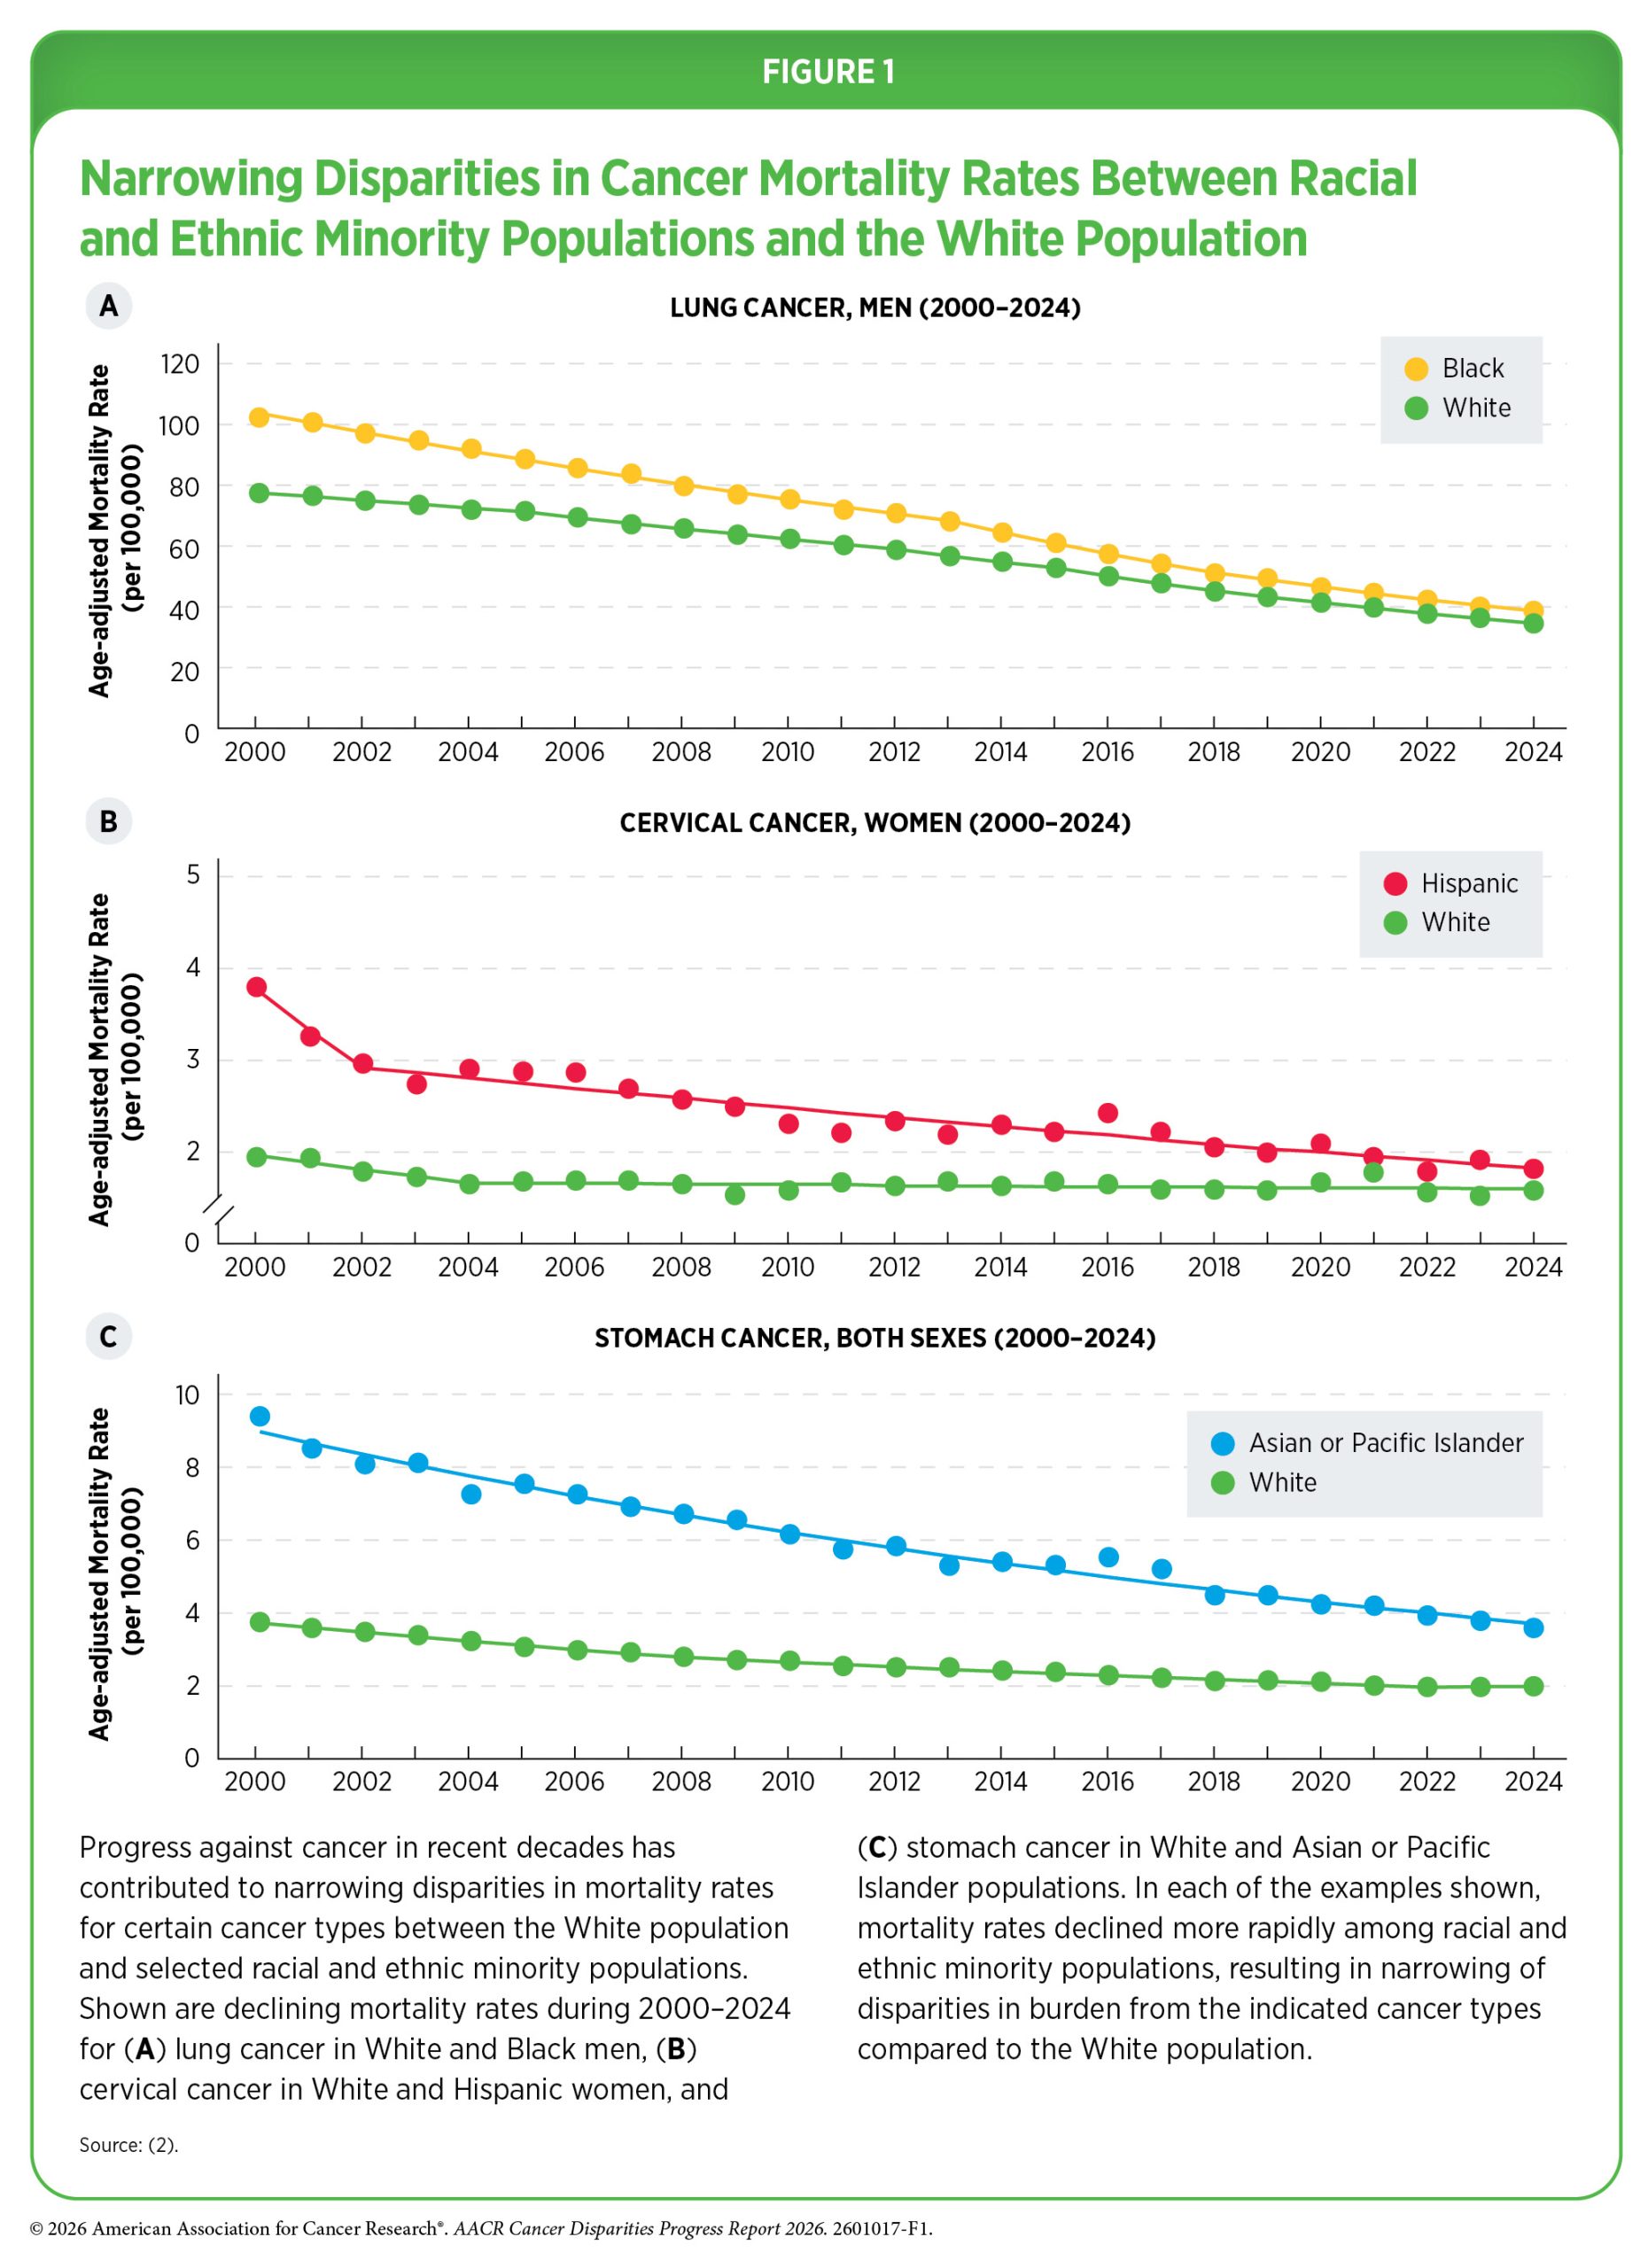
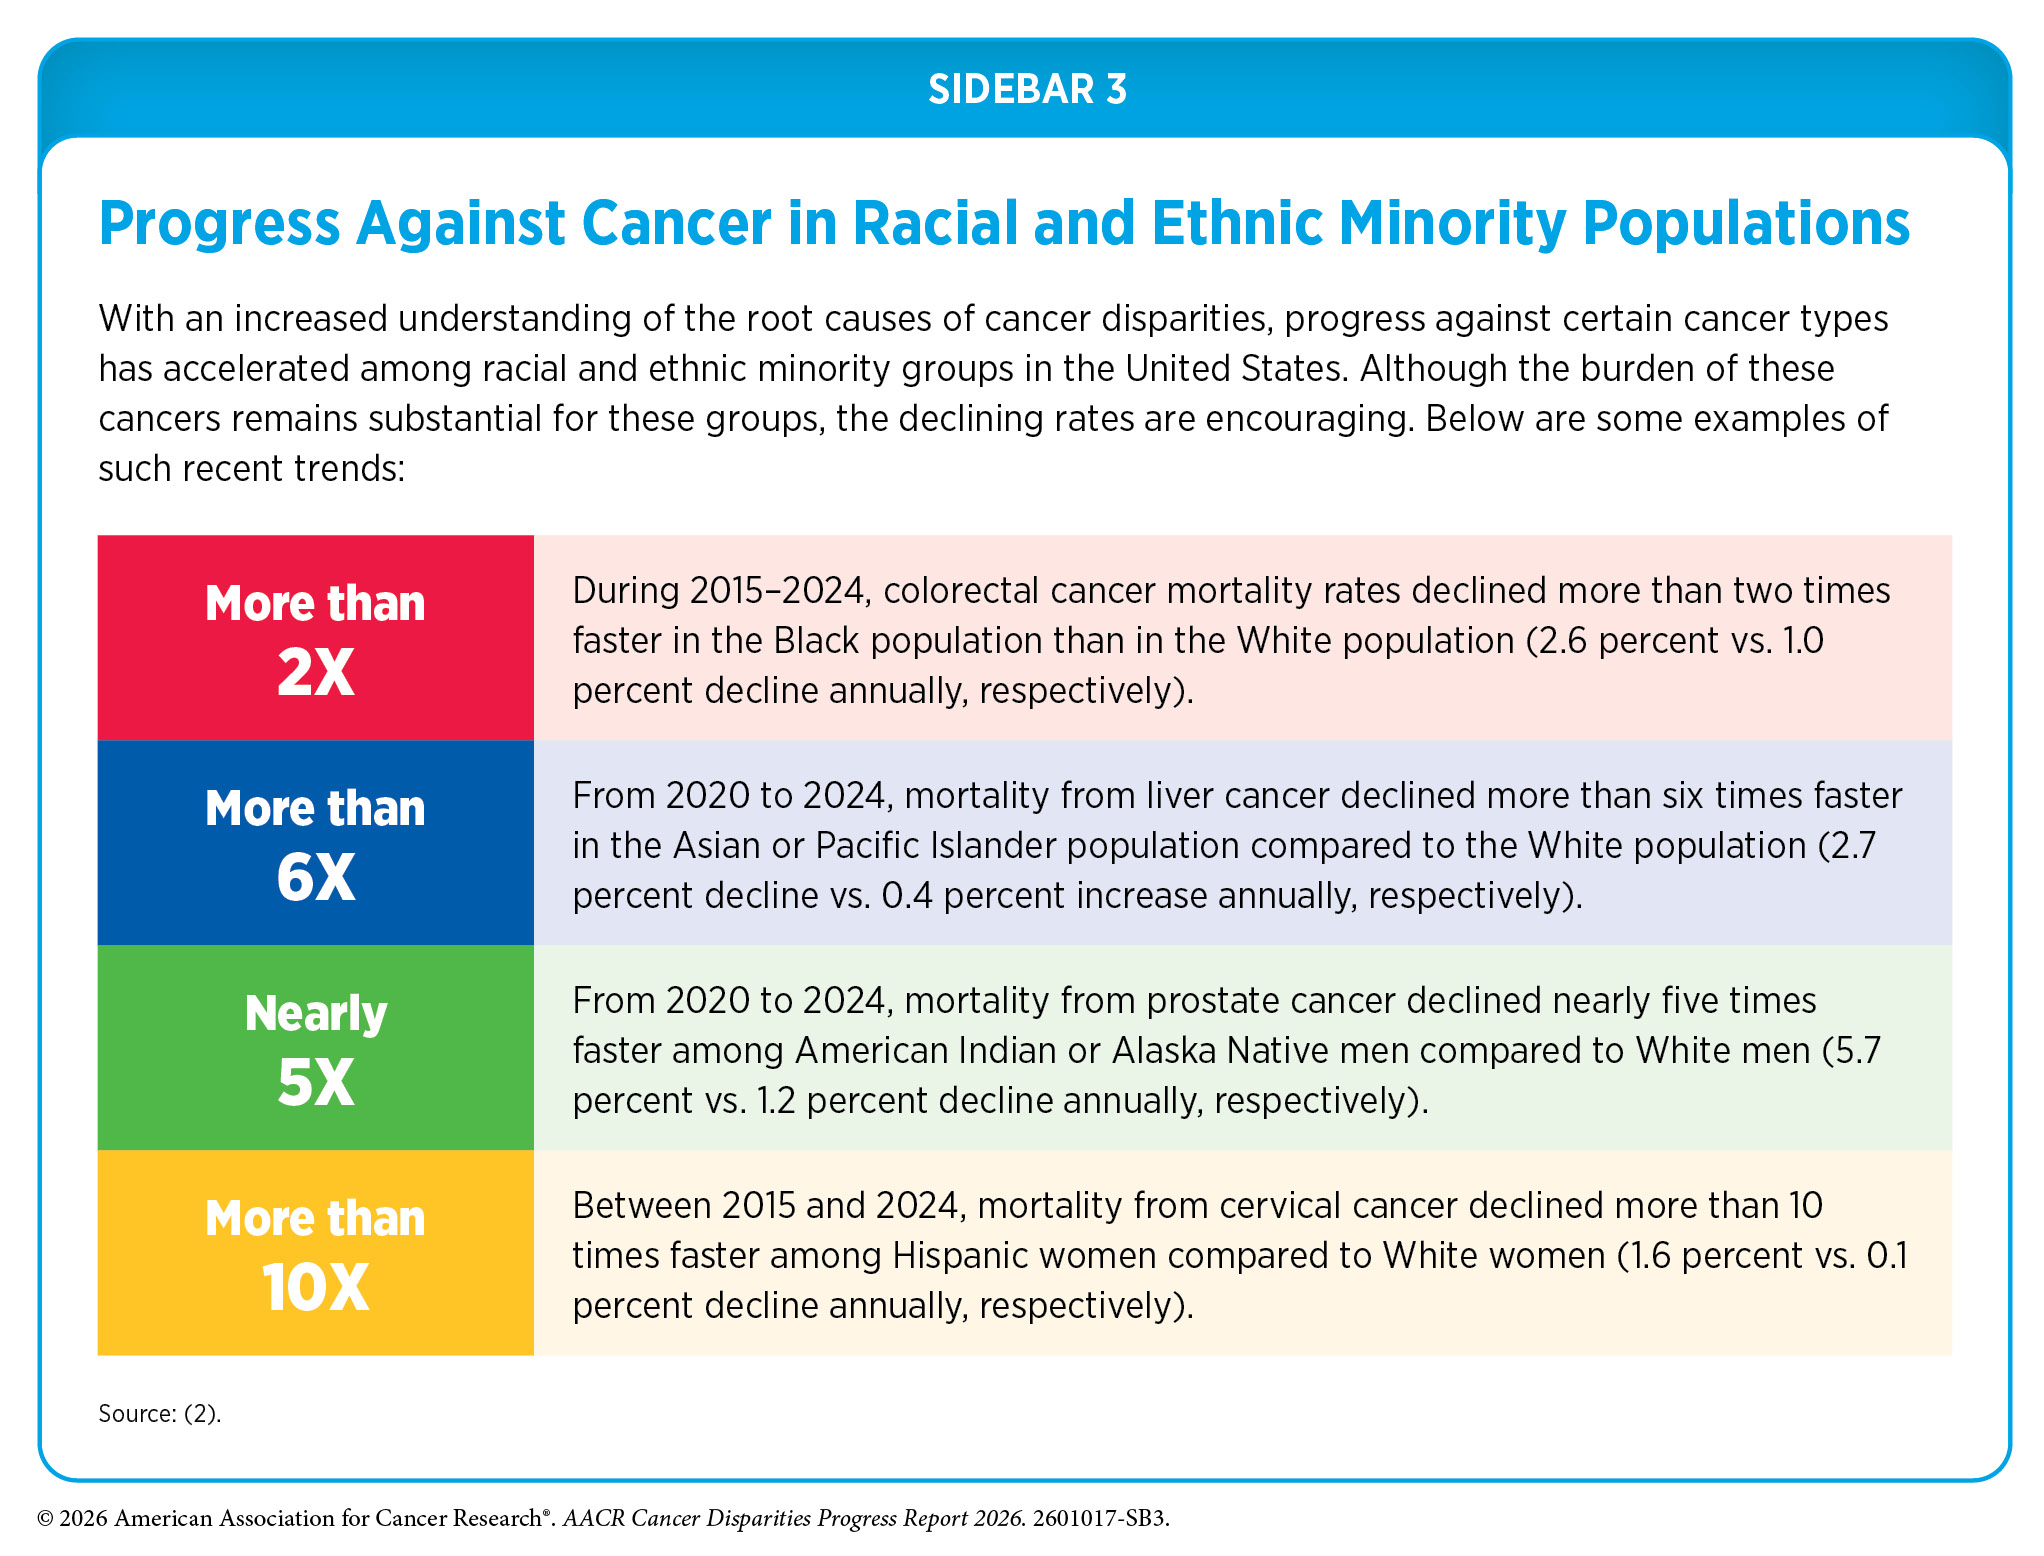
Sustained efforts across the cancer continuum have contributed to progress in reducing some disparities. Over the past two decades, declines in incidence and mortality for certain cancers have accelerated among some racial and ethnic minority populations relative to White populations (see Sidebar 3 and Figure 1).
For example, Black individuals continue to experience higher mortality for several major cancers, including prostate and breast cancers. Other populations, including Hispanic, Asian, and AIAN individuals, experience disproportionate burdens of infection-related cancers, such as liver and stomach cancers. The following sections provide an overview of the current state of cancer disparities among racial and ethnic minority populations in the United States.
Despite some progress, substantial disparities persist, and continued efforts are needed to eliminate cancer disparities between White populations and other racial and ethnic groups.
American Indian or Alaska Native (AIAN) Population
| At A Glance: American Indian or Alaska Native (AI/AN) Population |
| Number and proportion of the US population*: 2.3 million people or about 0.7 percent New cancer cases†: 11,740 Cancer deaths‡: 3,218 Most common cancers§: Female breast, lung and bronchus, and prostate cancers Most common cancer deaths§: Lung and bronchus, female breast, and colorectal cancers |
*Based on the Census 2020. Numbers shown are for those who identified as non-Hispanic (NH) AIAN alone, and not in combination with another race.
†Data indicate reported numbers of new cases for 2022 in the NH AIAN population.
‡Data indicate reported numbers of cancer deaths for 2023 in the NH AIAN population.
§Most common cancers were identified based on sites with the highest age-adjusted incidence (2018–2022) and mortality (2019–2023) rates.
Source: Ref. 8.
The AIAN population is highly diverse, comprising 575 federally recognized tribes and more than 200 that remain unrecognized, and encompassing a wide range of distinct cultural practices, languages, and histories. However, accurately characterizing the cancer burden in AIAN populations remains challenging due to persistent racial misclassification in cancer surveillance data (9)Espey DK, et al. (2014) Am J Public Health, 104 Suppl 3: S286. (10)Jim MA, et al. (2014) Am J Public Health, 104 Suppl 3: S295. . Evidence indicates that AIAN individuals are frequently misclassified as another racial group in cancer registries and on death certificates, leading to systematic underestimation of cancer burden and obscuring the true magnitude of disparities (11)Arias E, et al. (2021) Natl Vital Stat Rep, 70: 1. (12)Llaneza AJ, et al. (2024) Health Equity, 8: 376. . Although representation of AIAN individuals in national cancer databases has improved in recent years, continued efforts to improve race and ethnicity reporting and develop more robust surveillance tools remain critical for ensuring accurate estimates of cancer burden and informing equitable cancer prevention and control strategies (13)Satpathy Y, et al. (2023) JAMA Netw Open, 6: e2350237. (14)SEER*Stat Database: NAACCR Incidence Data – CiNA Research Data, 1995-2022, Public Use (19 Age Groups) (which includes data from CDC’s National Program of Cancer Registries (NPCR), CCR’s Provincial and Territorial Registries, and the NCI’s Surveillance, Epidemiology and End Results (SEER) Registries), submitted December 2024.
During 2019–2023, the overall incidence of all cancers combined was slightly lower in AIAN populations compared to White populations (442.0 vs. 482.2 per 100,000 population, respectively) (see Table 1 and Supplementary Table 1). However, when examined by cancer type, AIAN populations experienced a higher incidence than White populations for several cancer types. For example, incidence rates were about two-fold higher among AIAN populations than among White populations for cancers of the gallbladder, liver, and stomach, and 40 percent to 50 percent higher for cancers of the colorectum, cervix, and kidney.
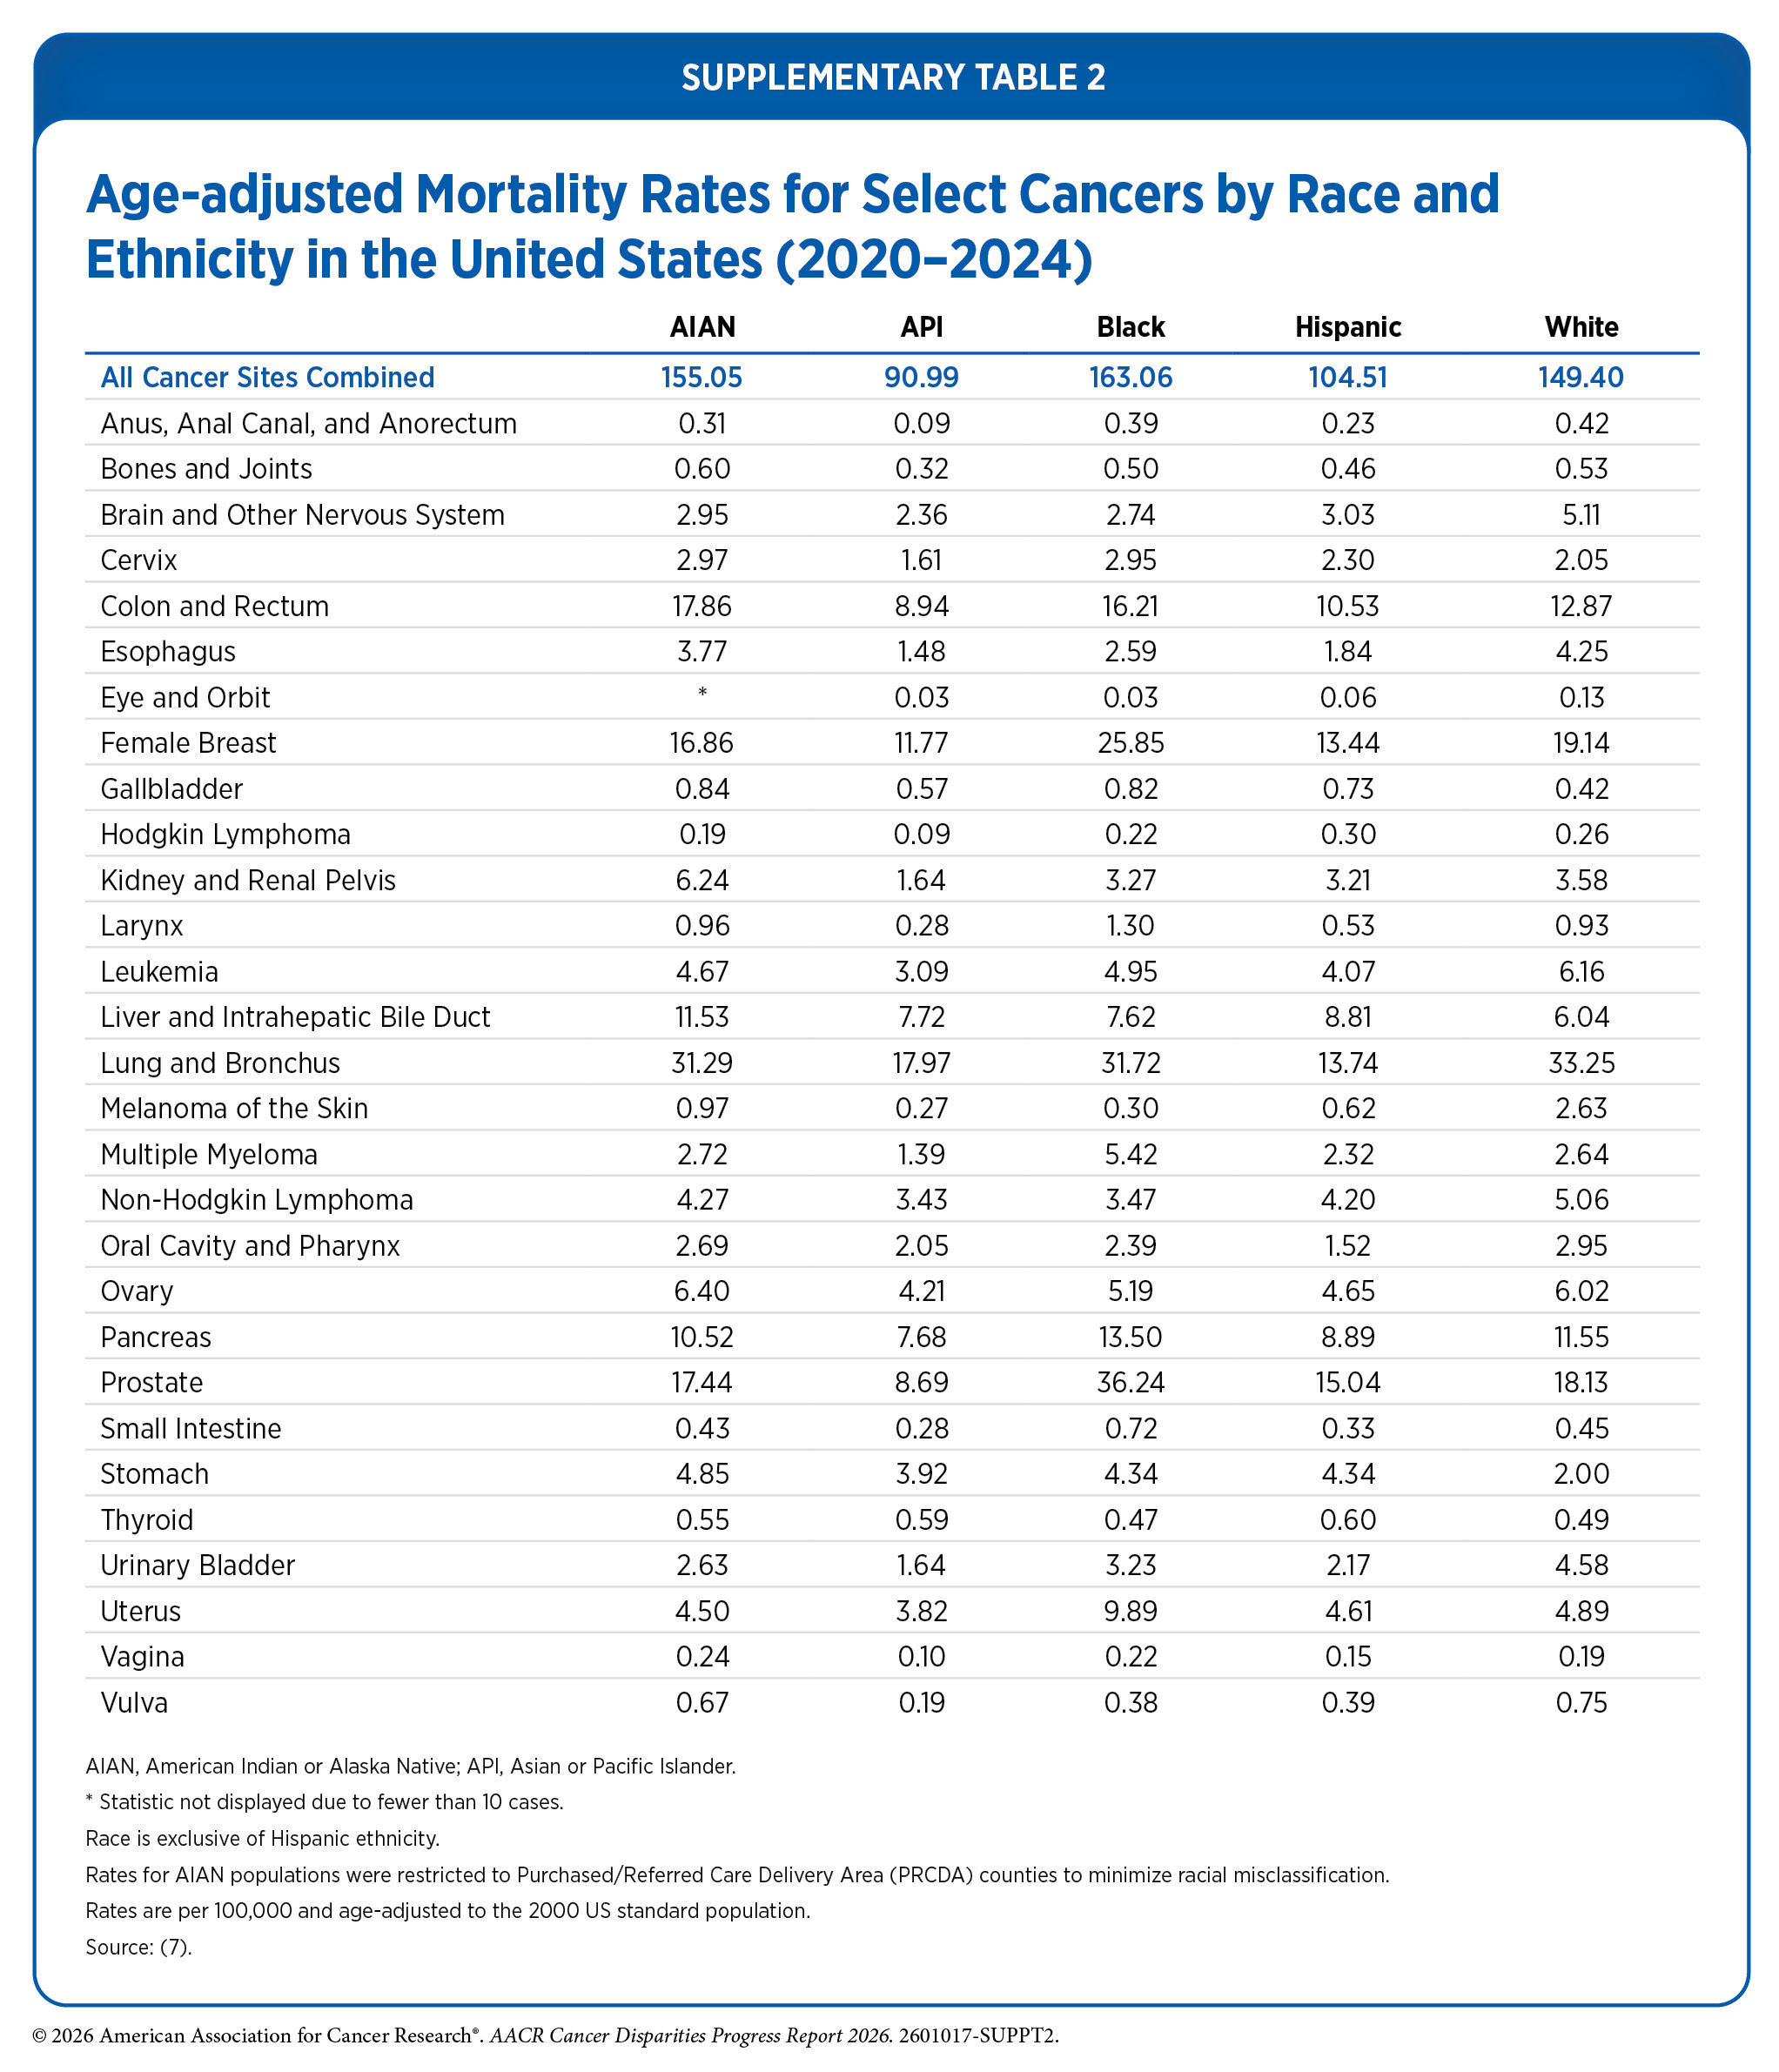
During 2020–2024, the overall mortality rate for all cancers combined was higher among AIAN individuals than among White individuals (155.1 vs. 149.4 deaths per 100,000 population, respectively) (see Table 1 and Supplementary Table 2). Mortality disparities were also evident across several individual cancer types. The largest disparities were observed for cancers of the stomach, gallbladder, and liver, for which mortality rates were twice as high among AIAN populations compared to White populations. Mortality rates for cancers of the kidney, cervix, and colorectum were also 74 percent, 45 percent, and 39 percent higher, respectively, among AIAN populations compared to White populations.
Cancer burden among AIAN populations varies substantially across geographic regions, revealing important disparities that are not apparent in national estimates. These disparities may be influenced by differences in the health care systems that serve AIAN communities. The Indian Health Service (IHS), within the Department of Health and Human Services (HHS), provides health care services to AIAN populations from federally recognized tribes through facilities operated directly by IHS, as well as by tribes and tribal organizations. If facilities are unable to provide needed care, the IHS and tribes may contract for health services from private providers through the IHS Purchased/Referred Care (PRC) program. Eligibility for PRC services is generally limited to individuals residing in designated Purchased/Referred Care Delivery Area (PRCDA) counties—geographic areas that include or border tribal lands and define the service population for the PRC program. Approximately two-thirds of the AIAN population resides in PRCDA counties, which are located across six IHS regions: Alaska, East, Northern Plains, Pacific Coast, Southern Plains, and Southwest (16)KFF. Key Data on Health and Health Care for American Indian or Alaska Native People. Accessed: March 31, 2026. .
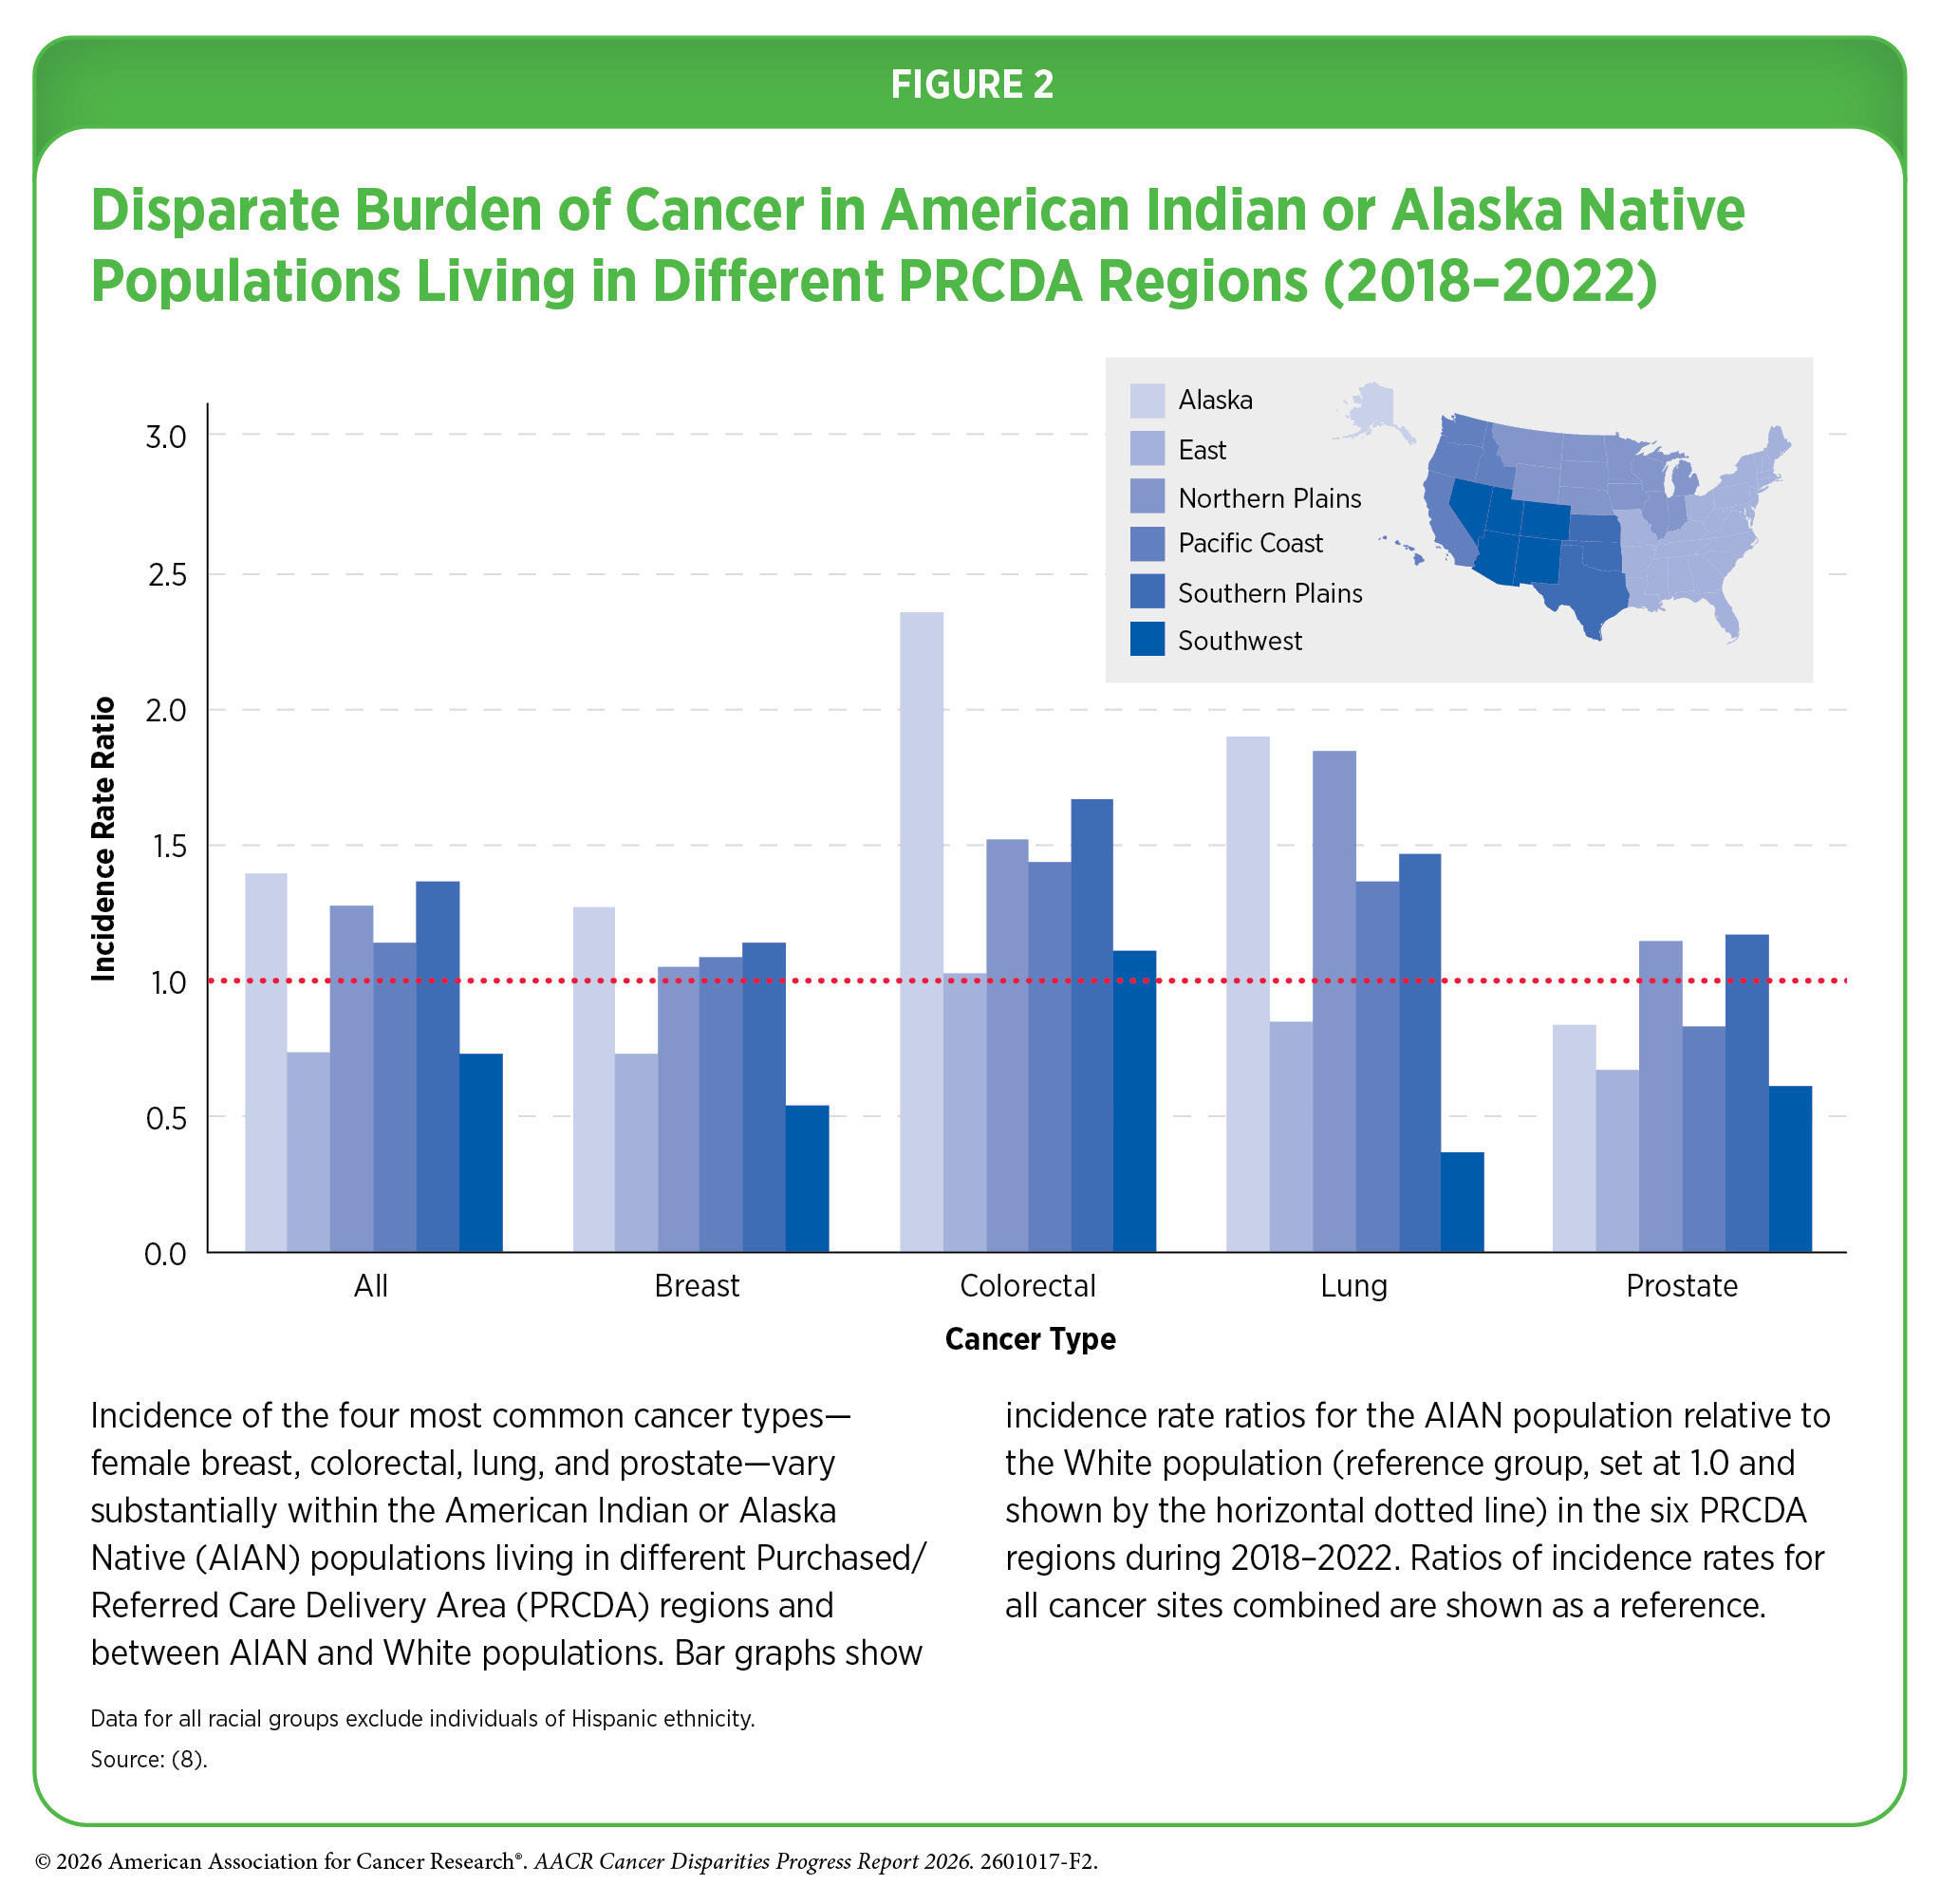
Although the incidence of all cancers combined is similar between AIAN and White populations when aggregated nationally (17)Islami F, et al. (2026) CA Cancer J Clin, 76: e70045. , important differences emerge when rates are disaggregated by PRCDA region. Compared to White populations, the incidence of all cancers combined during 2018–2022 was 27 percent lower among AIAN populations living in the Southwest but 40 percent higher among AIAN populations living in Alaska (see Figure 2). Similar patterns are observed for individual cancer types, highlighting disparities among AIAN populations residing in different regions and between AIAN and White populations within the same region. For example, AIAN individuals living in the Northern Plains region have nearly seven times higher incidence of lung cancer than those living in the Southwest. Compared to their White counterparts living in the same regions, lung cancer incidence was 90 percent higher among AIAN individuals living in Alaska but 63 percent lower among AIAN populations living in the Southwest (8)Centers for Disease Control and Prevention. Cancer Statistics At a Glance. Accessed: March 17, 2026. .
Importantly, aggregating American Indian individuals with Alaska Native individuals, which are distinct populations, into a single category can mask substantial disparities in cancer burden (see Sidebar 4). Alaska Native individuals, for example, have the highest colorectal cancer (CRC) incidence and mortality rates in the United States and globally (18)Haverkamp D, et al. (2023) Int J Circumpolar Health, 82: 2184749. . Recent data indicate that CRC incidence and mortality rates among Alaska Native populations (80.9 and 31.5 per 100,000, respectively) are more than two-fold higher than those among White populations (35.2 and 12.9 per 100,000, respectively) and more than 1.6-fold higher than those among American Indian populations (49.3 and 17.7 per 100,000, respectively) (19)Siegel RL, et al. (2026) CA Cancer J Clin, 76: e70067. . However, these differences are less apparent when AIAN populations are examined in aggregate, where CRC incidence and mortality rates are approximately 45 percent higher than those among White population.
The burden of early-onset CRC, defined as CRC diagnosed in individuals age 18 to 49 years, is increasing among American Indian populations in the United States. Over the past decade, the incidence of early-onset CRC increased twice as fast among American Indian populations as among White individuals (3.4 percent vs. 1.7 percent annually, respectively) (20)Kratzer TB, et al. (2023) CA Cancer J Clin, 73: 120. . Similarly, deaths from early-onset CRC during 2014–2023 increased by 2.6 percent annually among American Indian individuals, compared to a 1.6 percent annual increase in White individuals (19)Siegel RL, et al. (2026) CA Cancer J Clin, 76: e70067. .
These patterns are also evident in analyses of individual Tribal Nations, further highlighting disparities in cancer burden within AIAN populations. A recent analysis of cancer burden among Navajo individuals residing in six counties that encompass the Navajo Nation—the largest federally recognized Tribal Nation in the United States—reveals distinct patterns that are not apparent in regional or national estimates. Although overall cancer incidence rates during 2014–2018 were 34 percent lower among Navajo individuals than among White individuals, incidence rates for certain cancers were substantially higher, including more than six-fold higher rates of gallbladder cancer and more than three-fold higher rates of stomach cancer (25)Yazzie D, et al. (2025) Cancer, 131: e70202. . Elevated incidence rates were also observed for kidney and liver cancers and multiple myeloma among Navajo individuals compared to White individuals. In contrast, incidence was lower for several other cancers, including breast, prostate, and pancreatic cancers, leukemia, and non-Hodgkin lymphoma among Navajo individuals compared to White individuals living in the same geographic areas (25)Yazzie D, et al. (2025) Cancer, 131: e70202. .
Incidence trends also differed between Navajo and White individuals for certain cancer types. For example, CRC incidence increased by 3.6 percent annually among Navajo individuals during 1998–2018, whereas rates declined by 2.2 percent annually among White individuals during the same time period. Breast cancer incidence remained largely stable, while prostate cancer incidence decreased over time among both Navajo and White men (25)Yazzie D, et al. (2025) Cancer, 131: e70202. .
Reasons for disparities in cancer burden between AIAN and White populations, as well as those within the AIAN population, stem from a long history of racism, discrimination, and systemic inequities in the United States that have substantially contributed to higher usage of tobacco and alcohol, higher exposure to environmental carcinogens, higher rates of type 2 diabetes and chronic hepatitis C virus (HCV) infection, as well as lower access to quality health care (see Disparities in the Burden of Modifiable Behavioral Cancer Risk Factors) (20)Kratzer TB, et al. (2023) CA Cancer J Clin, 73: 120. .
The Asian population is the fastest-growing racial group in the United States (26)Pew Research Center. Asian Americans are the fastest-growing racial or ethnic group in the U.S. Accessed: March 17, 2024. . The six largest groups constituting the Asian designation are Chinese, South Asian, Filipino, Vietnamese, Korean, and Japanese. Despite the remarkable diversity of cultures, places of birth, migration histories, and other characteristics that distinguish Asian populations from Native Hawaiian or Pacific Islander populations, health data for these distinct groups are often aggregated into a single Asian or Pacific Islander (API) category, which masks important differences within these populations (see Sidebar 4). In this report, we use the API designation for some of the cancer incidence and mortality rates that are only available as aggregate data.
Recent data indicate that the API population has the lowest overall cancer incidence (2019–2023) and mortality (2020–2024) rates among all racial and ethnic groups (see Table 1). However, according to the Centers for Disease Control and Prevention (CDC), cancer was the leading cause of death among the Asian population in 2024, the most recent year for which such data are available (27)Centers for Disease Control and Prevention. Underlying Cause of Death, 2018-2021, Single Race. Accessed: March 17, 2024. .
Asian Population
| At A Glance: Asian Population |
| Number and proportion of the US population*: 19.6 million people or 5.9 percent New cancer cases†: 72,114 Cancer deaths‡: 20,055 Most common cancers§: Female breast, lung and bronchus cancers, and prostate cancers Most common causes of cancer deaths§: Lung and bronchus, female breast, and colorectal cancers |
* Based on the Census 2020. Numbers shown are for those who identified as non-Hispanic (NH) Asian alone and do not include the Native Hawaiian or Pacific Islander population.
† Data indicate reported numbers of new cases for 2022 in the aggregated NH Asian or Pacific Islander (API) population.
‡ Data indicate reported numbers of cancer deaths for 2023 in the NH Asian population and do not include the Native Hawaiian or Pacific Islander population.
§ Most common cancers were identified based on sites with the highest age-adjusted incidence (2018–2022) and mortality (2019–2023) rates.
Source: Ref. 8.
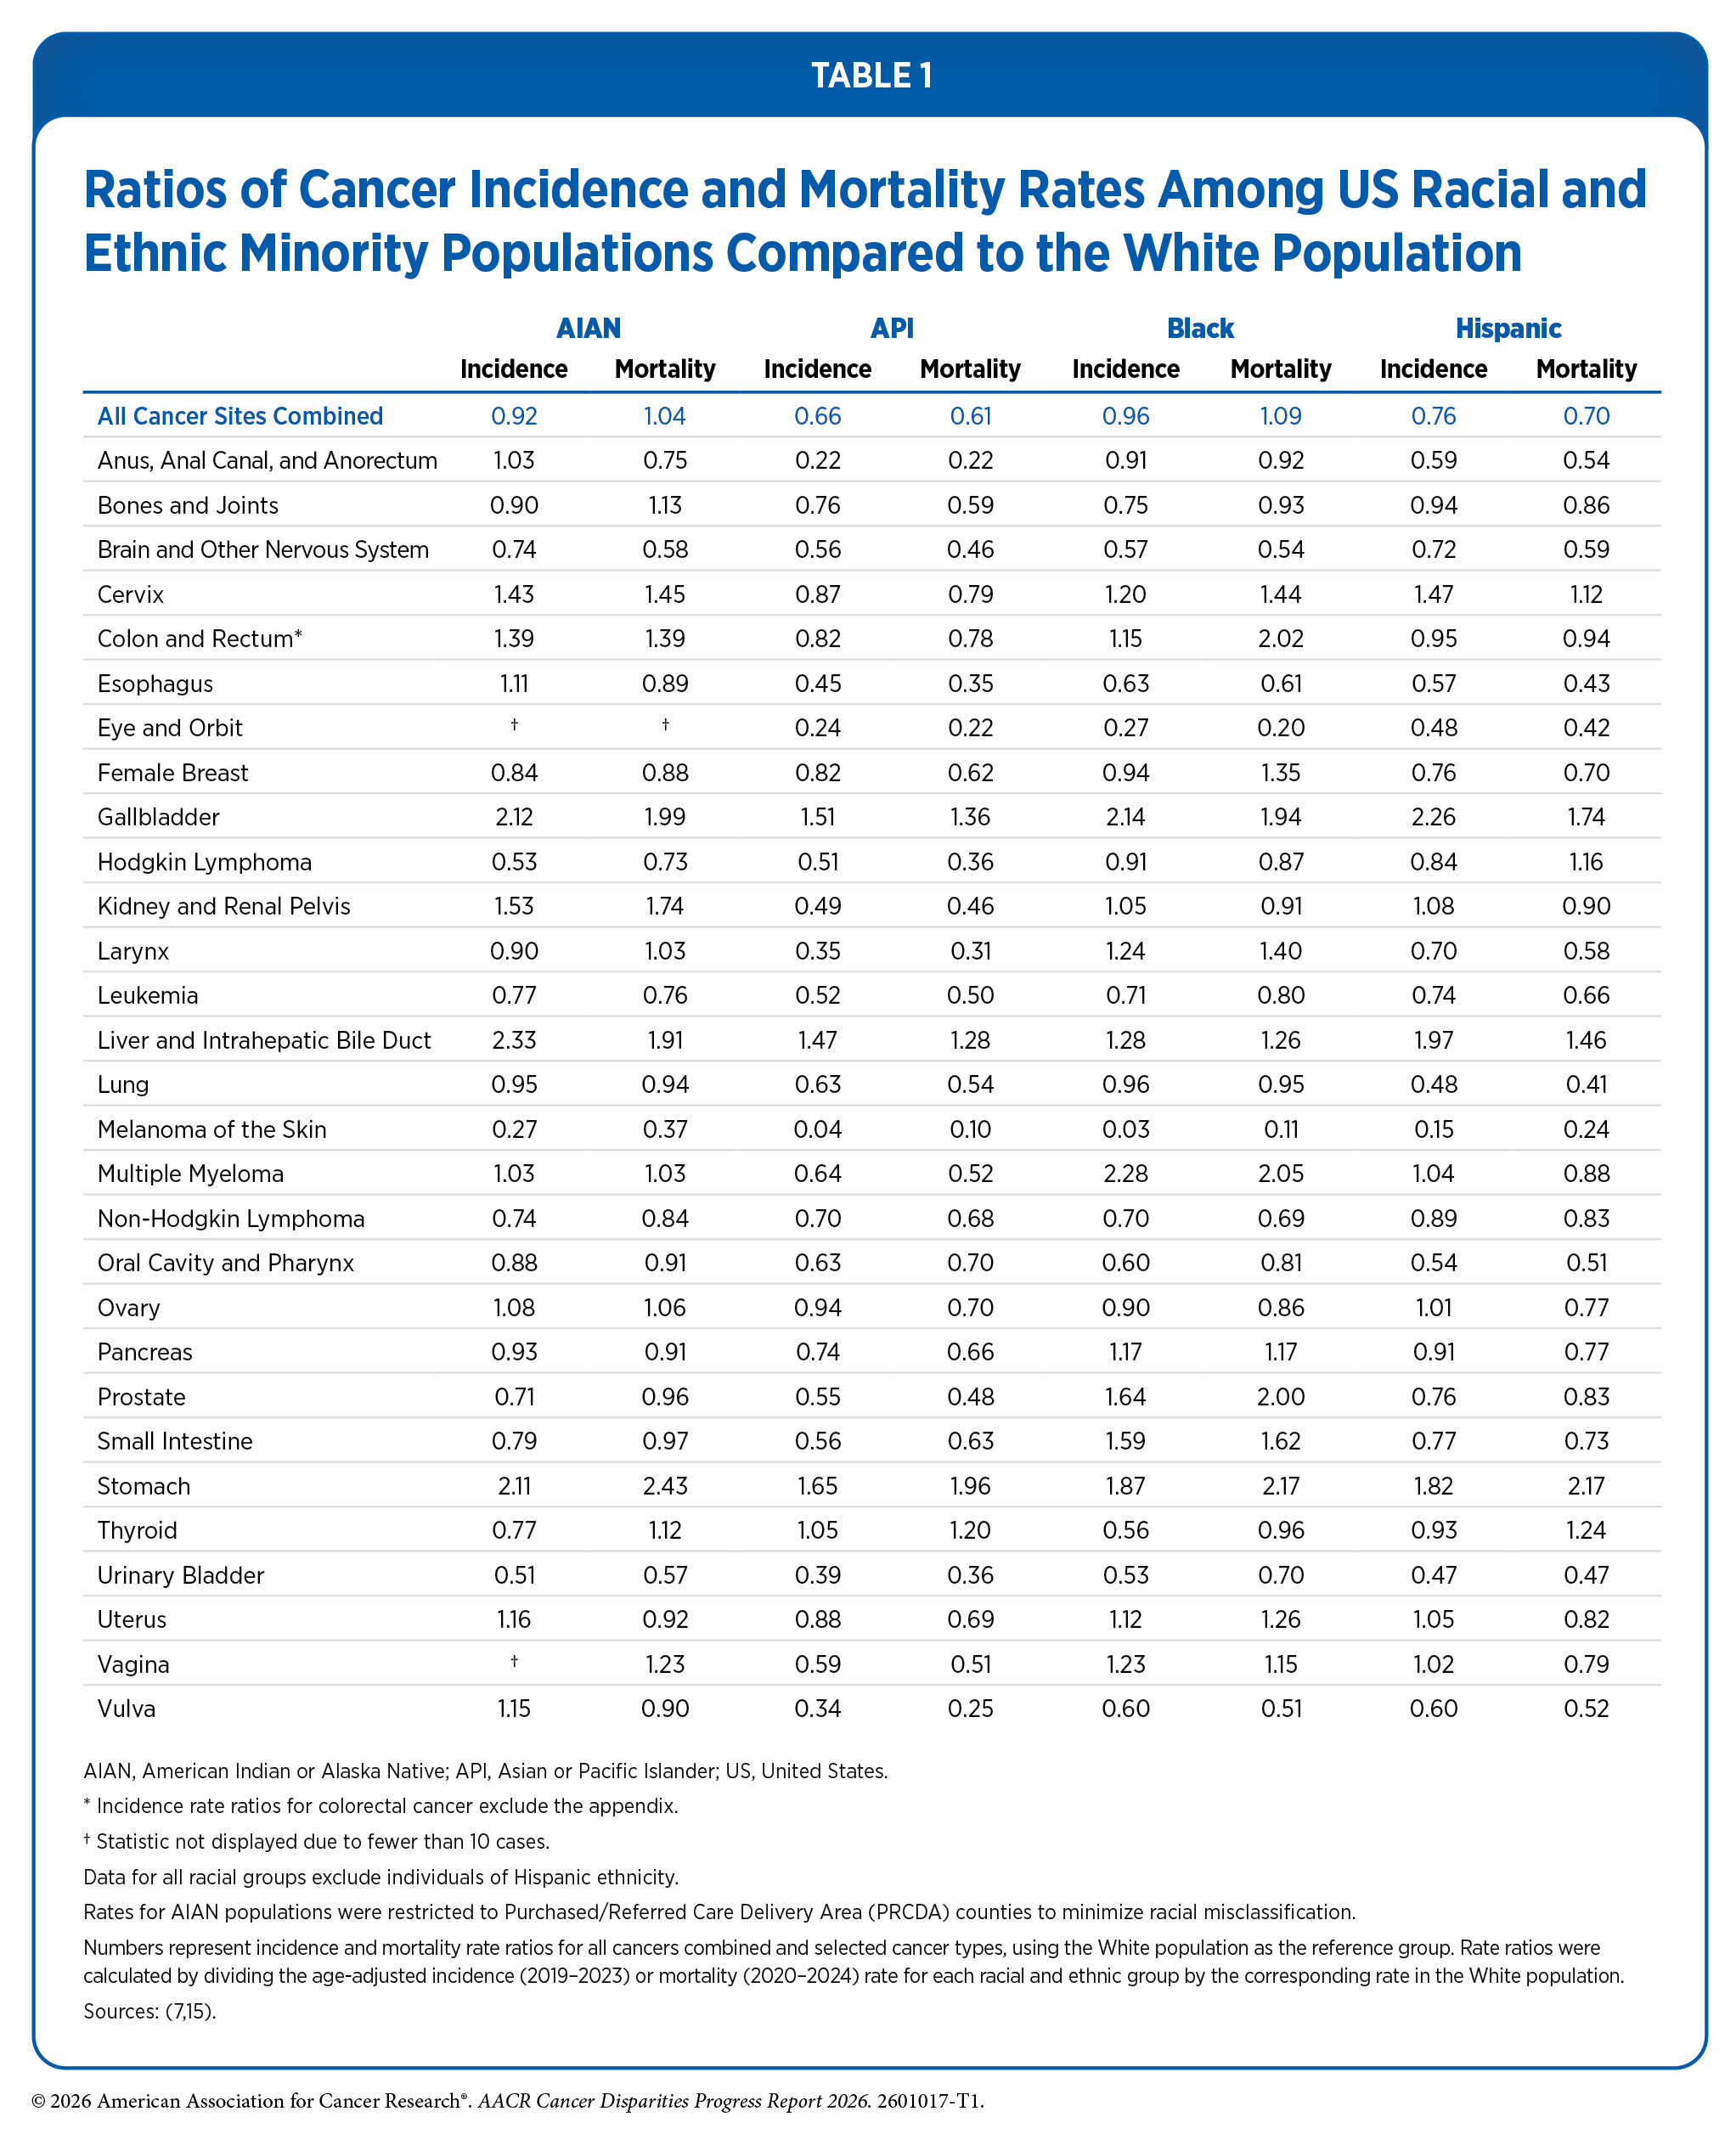
The Asian population is disproportionately affected by cancers caused by infectious agents, such as hepatitis B virus (HBV) and Helicobacter pylori (H. pylori) (see Disparities in the Burden of Modifiable Behavioral Cancer Risk Factors) (29)Lee RJ, et al. (2021) The Oncologist, 26: 453. . For example, API individuals have a 65 percent higher incidence of stomach cancer and a two-fold higher mortality from the disease compared to White individuals (see Table 1); approximately 75 percent of noncardia stomach cancer cases worldwide are attributable to H. pylori (30)Park JY, et al. (2025) Nat Med, 31: 3020. . Similarly, Asian American individuals have 50 percent and 32 percent higher mortality from gallbladder and liver cancers, respectively, compared to White individuals, both of which are primarily caused by HBV infection (8)Centers for Disease Control and Prevention. Cancer Statistics At a Glance. Accessed: March 17, 2026. .
A concerning trend is the rising incidence of breast cancer among API women. Although breast cancer incidence is increasing across all racial and ethnic groups, rates are rising the fastest among API women. For example, during 2012–2021, breast cancer incidence increased by 2.6 percent annually among API women compared to 1.0 percent annually among White women (31)Giaquinto AN, et al. (2024) CA Cancer J Clin, 74: 477. . Breast cancer incidence rates among API women are lower than those of White women (see Table 1), but this gap is narrowing due to the steeper increases among API women. Nonetheless, breast cancer mortality rates among Asian women remain the lowest of all racial and ethnic groups (8)Centers for Disease Control and Prevention. Cancer Statistics At a Glance. Accessed: March 17, 2026. and 5-year breast cancer survival rates are comparable to those of White women (32)SEER*Stat Database: NCCR Survival Data (ages 0-39), 23 States and Seattle, Dec 2024 NAACCR Sub (1997-2022) (which includes data from CDC’s National Program of Cancer Registries (NPCR), CCR’s Provincial and Territorial Registries, and the NCI’s Surveillance, Epidemiology and End Results (SEER) Registries). Registries included: CO, CA, CT, GA, HI, ID, IL, IA, KY, LA, MA, MI, MN, MO, NJ, NY, NM, NY, OR, PA, TN, TX, WI, UT, and Seattle. . The steeper increase in incidence may partly reflect the growing proportion of non–US-born Asian individuals in the United States, as evidence suggests that non–US-born Asian women have higher breast cancer risk than their US-born counterparts (31)Giaquinto AN, et al. (2024) CA Cancer J Clin, 74: 477. (33)Morey BN, et al. (2019) Prev Chronic Dis, 16: E20. . Research efforts, such as the CRANE (Breast Cancer Risk among Asian Americans) Study, are underway to better understand the factors driving the rising breast cancer incidence among Asian American women (34)University of California San Francisco. Crane Study. Accessed: March 31, 2026. .
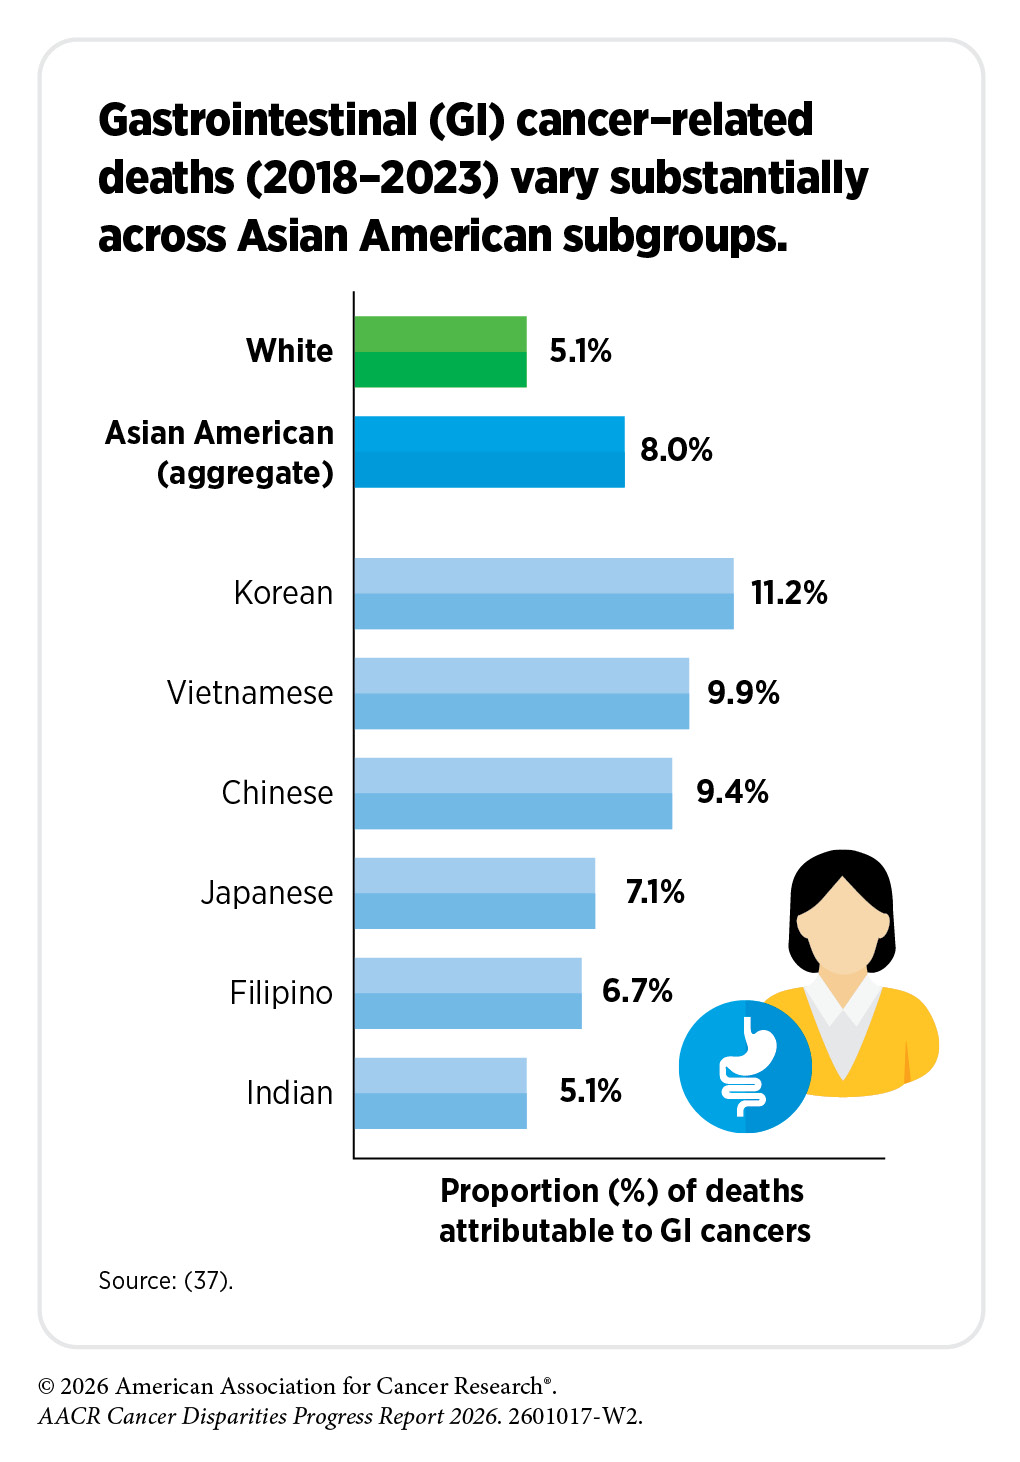
Recent studies analyzing disaggregated data have shown a unique cancer burden for subgroups within the Asian population. One study identified large disparities in the burden of hepatocellular carcinoma (HCC), a common type of liver cancer. Among individuals in California during 2010–2018, HCC incidence rates among API men and women overall (17.1 and 5.5 cases per 100,000, respectively) were approximately two-fold higher than those among White men and women (9.2 and 2.6 cases per 100,000, respectively) (35)Pinheiro PS, et al. (2025) JAMA Netw Open, 8: e252208. . However, when disaggregated, HCC incidence varied substantially across Asian American subgroups compared to White individuals. HCC incidence rates, for example, were more than five times higher among Cambodian men and women (48.6 and 14.0 per 100,000), but approximately 10 percent lower among South Asian men and women (8.4 and 2.4 per 100,000), compared to White men and women (9.2 and 2.6 per 100,000) (35)Pinheiro PS, et al. (2025) JAMA Netw Open, 8: e252208. .
Similar patterns have been observed for HCC mortality rates. A study of HCC mortality rates from 2005–2020 found that rates were approximately 80 percent higher among API individuals overall than those among White individuals (4.1 vs. 2.3 per 100,000, respectively) (36)Park A, et al. (2025) Cancer Med, 14: e71259. . However, disaggregation revealed considerable heterogeneity in mortality rates across Asian American subgroups compared to White individuals. For example, HCC mortality rates were between two- and three-fold higher among Vietnamese (7.7 per 100,000), Korean (5.4 per 100,000), and Chinese (4.7 per 100,000) individuals, compared to White individuals, whereas rates among Asian Indian individuals were approximately 45 percent lower (1.3 per 100,000, respectively) by comparison (36)Park A, et al. (2025) Cancer Med, 14: e71259. .
A concerning trend contributing to cancer disparities in the Asian population is the growing burden of lung cancer among women who have never smoked. A 2023 study found that among women who have never smoked, lung cancer incidence rates were approximately 1.7-fold to 2.3-fold higher across Asian American subgroups compared to White women, with the exception of Japanese American women, whose rates were approximately 40 percent lower (38)DeRouen MC, et al. (2022) J Natl Cancer Inst, 114: 78. . Lung cancer incidence rates were highest among Chinese American (22.8 per 100,000) and Filipino American (20.1 per 100,000) women who have never smoked, with rates approximately two-fold higher than those of White women (10.1 per 100,000) and more than three-fold higher than those of Japanese American women (6.4 per 100,000) (38)DeRouen MC, et al. (2022) J Natl Cancer Inst, 114: 78. . Another study found that, from 2007 to 2018, lung cancer incidence rates among adults who have never smoked remained stable across all racial and ethnic groups, except for API individuals, whose incidence increased by an average of 2 percent per year during this period (39)Sakoda LC, et al. (2023) Chest, 164: 785. . There is also evidence of substantial sex-based differences in age at lung cancer diagnosis among Asian American populations. In one study, Chinese American women who never smoked were diagnosed, on average, approximately 11 years earlier than Chinese American men (40)Blechter B, et al. (2024) Br J Cancer, 130: 1286. .
Studies have identified genetic and epigenetic alterations, as well as exposure to environmental and occupational carcinogens, as important contributors to lung cancer risk among individuals who have never smoked. Established risk factors include exposure to secondhand and thirdhand smoke, radon, air pollution, and cooking oil fumes (41)Murphy C, et al. (2025) JAMA, 334: 1836. . However, it is not known if these factors explain the higher lung cancer incidence or the increasing rates observed among Asian American women who have never smoked, suggesting that additional biological, environmental, or contextual factors remain incompletely understood (42)Gomez SL, et al. (2025) J Natl Cancer Inst, 117: 1104. .
The Female Asian Never Smokers (FANS) study aims to address these critical knowledge gaps by investigating the underlying causes of lung cancer among Asian women who have never smoked. Findings from this study are expected to generate key insights to inform risk stratification, prevention strategies, and potential screening approaches in this population (43)University of California San Francisco. FANS Study. Accessed: March 31, 2026. . Complementing this effort, the Female Asian Never Smokers Screening Study (FANSS) is evaluating the feasibility of lung cancer screening in Asian American women who have never smoked, with early findings supporting the potential value of low-dose computed tomography (CT) screening in this population (44)International Association for the Study of Lung Cancer. FANSS Study Demonstrates Feasibility of U.S.-Based Lung Cancer Screening in Asian Female Nonsmokers. Accessed: March 31, 2026. . Additional studies are underway to better understand non–smoking-related risk factors for lung cancer among Asian American women who have never smoked and to inform risk stratification, prevention, and screening approaches in this population (45)National Cancer Institute. Sherlock-Lung: Tracing Lung Cancer Mutational Processes in Never Smokers. Accessed: March 31, 2026. (46)ClinicalTrials.gov. Lung Cancer Screening in Population Who Had Never Smoked. Accessed: March 31, 2026. .
Black Population
| At A Glance: Black Population |
| Number and proportion of the US population*: Estimated 39.9 million people or 12.1 percent New cancer cases†: 204,615 Cancer deaths‡: 70,759 Most common cancers§: Prostate, female breast, and lung and bronchus cancers Most common causes of cancer deaths§: Prostate, lung and bronchus, and female breast cancers |
* Based on the Census 2020. Numbers shown are for those who identified as non-Hispanic (NH) Black alone, and not in combination with another race.
† Data indicate reported numbers of new cases for 2022 in the NH Black population.
‡ Data indicate reported numbers of cancer deaths for 2023 in the NH Black population.
§ Most common cancers were identified based on sites with the highest age-adjusted incidence (2018–2022) and mortality (2019–2023) rates.
Source: Ref. 8.
Black individuals represent the third largest racial and ethnic group in the United States, accounting for approximately 12 percent of the population. The US Black population is heterogeneous and includes individuals who were born in the United States, as well as those who have immigrated to the United States and trace their ancestry to the Black racial groups of Africa and the African diaspora. This heterogeneity is important to recognize, as meaningful differences in cancer burden exist across subgroups within the Black population.
In recent decades, the disparity in age-adjusted overall cancer death rates between Black and White populations has decreased substantially, narrowing from 34 percent higher rates among Black individuals in 1991 to 9 percent higher in 2024 (7)SEER*Stat Database: Mortality – All COD, Aggregated With State, Total U.S. (1990-2023) , National Cancer Institute, DCCPS, Surveillance Research Program, released February 2025.. This narrowing disparity reflects faster declines in cancer mortality among Black individuals, particularly Black men. For example, Black men experienced the largest relative decline in cancer mortality of any racial and ethnic group, with rates decreasing by more than 50 percent from 1991 to 2024, largely due to reductions in smoking initiation, advances in treatment, and earlier detections for some cancers (2)SEER*Explorer: An interactive website for SEER cancer statistics [Internet]. Surveillance Research Program, National Cancer Institute; 2026 Apr 22. [cited 2026 May 11]. Data source(s): SEER Incidence Data, November 2025 Submission (1975-2023), SEER 21 registries. (17)Islami F, et al. (2026) CA Cancer J Clin, 76: e70045. . Importantly, these gains have accelerated in recent years. From 2020 to 2024, cancer mortality rates declined faster among Black individuals than White individuals for both males (2.5 percent vs. 1.6 percent per year) and females (1.7 percent vs. 1.2 percent per year) (2)SEER*Explorer: An interactive website for SEER cancer statistics [Internet]. Surveillance Research Program, National Cancer Institute; 2026 Apr 22. [cited 2026 May 11]. Data source(s): SEER Incidence Data, November 2025 Submission (1975-2023), SEER 21 registries. . Despite this progress, Black individuals continue to experience the highest overall cancer death rate of any major racial or ethnic group in the United States.
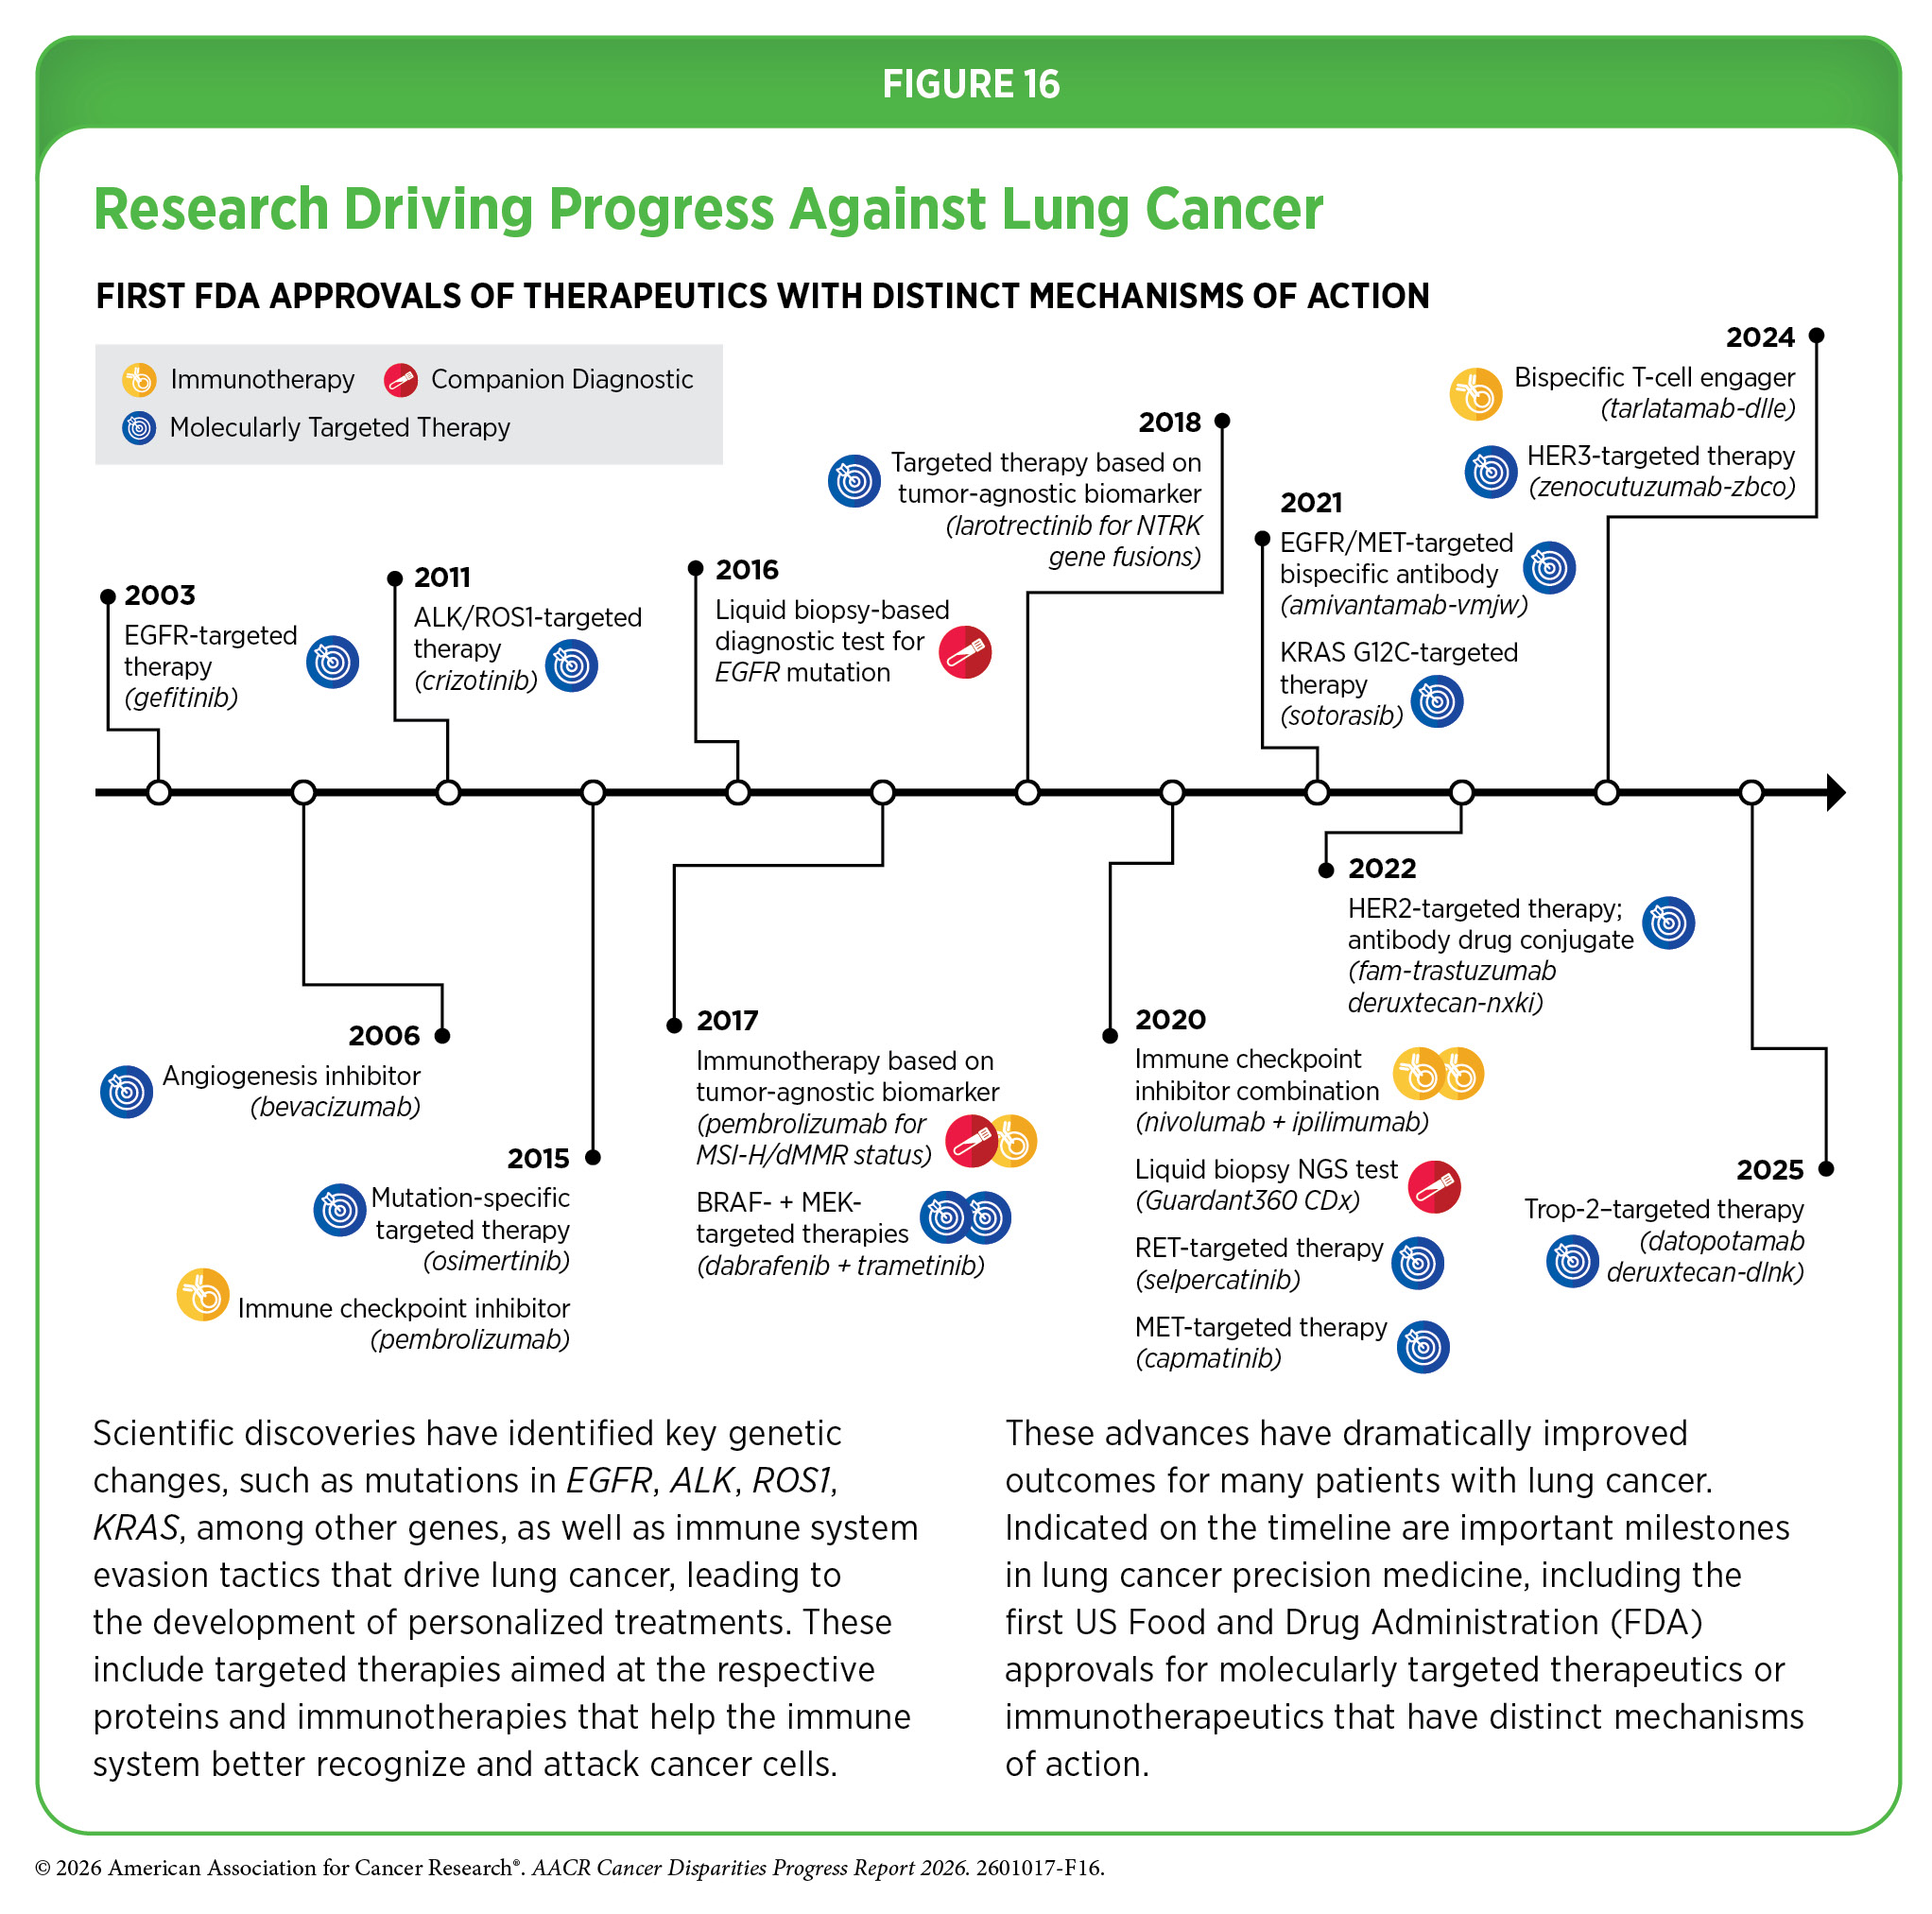
Narrowing disparities between Black and White populations have also been observed for certain cancer types, with lung cancer representing one of the clearest examples of progress (see Figure 2). Lung cancer mortality rates have declined since 1990 at a generally faster pace among Black individuals than White individuals, resulting in a substantial reduction in disparities (47)Saka AH, et al. (2025) CA Cancer J Clin, 75: 111. . For example, lung cancer mortality rates among Black individuals were 23 percent higher than those of White individuals in 1991; by 2024, rates were approximately 4 percent lower among Black individuals. These declines reflect, in part, reductions in smoking prevalence driven by population-level tobacco control efforts, including targeted cessation initiatives (see Policies and Regulations to Reduce the Disparate Harms of Tobacco Products), as well as advances in early detection (see Lung Cancer Screening) and treatment (see Figure 16). Notably, lung cancer mortality patterns differ by sex: Rates from 2020–2024 were 12 percent higher among Black men than White men, but 17 percent lower among Black women than White women (2)SEER*Explorer: An interactive website for SEER cancer statistics [Internet]. Surveillance Research Program, National Cancer Institute; 2026 Apr 22. [cited 2026 May 11]. Data source(s): SEER Incidence Data, November 2025 Submission (1975-2023), SEER 21 registries. (17)Islami F, et al. (2026) CA Cancer J Clin, 76: e70045. .

CRC provides another example of progress. The disparity in CRC mortality between Black and White populations—the third leading cause of cancer death among Black men and women—has steadily narrowed, from 40 percent higher rates among Black individuals in 2000 to 21 percent higher in 2024 (2)SEER*Explorer: An interactive website for SEER cancer statistics [Internet]. Surveillance Research Program, National Cancer Institute; 2026 Apr 22. [cited 2026 May 11]. Data source(s): SEER Incidence Data, November 2025 Submission (1975-2023), SEER 21 registries. . Recent trends further illustrate this pattern. From 2020 to 2024, CRC mortality rates decreased by 2.6 percent annually among Black individuals compared to declines of 0.2 percent annually among White individuals (2)SEER*Explorer: An interactive website for SEER cancer statistics [Internet]. Surveillance Research Program, National Cancer Institute; 2026 Apr 22. [cited 2026 May 11]. Data source(s): SEER Incidence Data, November 2025 Submission (1975-2023), SEER 21 registries. (19)Siegel RL, et al. (2026) CA Cancer J Clin, 76: e70067. . These faster declines likely reflect, in part, increased uptake of CRC screening and early detection (see Colorectal Cancer Screening), particularly among Black populations with historically higher disease burden, as well as advances in treatment and improvements in access to care (see Facilitating Equity in Clinical Cancer Research) (19)Siegel RL, et al. (2026) CA Cancer J Clin, 76: e70067. . However, improvements in CRC have not been uniform across age groups; compared to White individuals, Black individuals with early-onset CRC are more likely to present with advanced-stage disease, as was the case with the colon cancer diagnosis of Janaylon Wright, and have a 34 percent to 59 percent higher risk of death (48)Tsai MH, et al. (2025) Cancer Control, 32: 10732748251357469. .
Despite some progress, Black populations continue to experience a disproportionate burden of cancer in the United States. From 2020 to 2024, overall cancer mortality rates were 13 percent higher among Black men than White men, despite only a 3 percent higher incidence rate, and 9 percent higher among Black women, despite a 10 percent lower incidence rate (2)SEER*Explorer: An interactive website for SEER cancer statistics [Internet]. Surveillance Research Program, National Cancer Institute; 2026 Apr 22. [cited 2026 May 11]. Data source(s): SEER Incidence Data, November 2025 Submission (1975-2023), SEER 21 registries. . Similarly, breast cancer mortality rates were 35 percent higher among Black women than White women, despite a 6 percent lower incidence rate (see Table 1). Disparities are particularly pronounced for certain cancer types, including multiple myeloma and cancers of the stomach, prostate, and gallbladder, for which death rates are approximately twice as high among Black individuals as White individuals (see Table 1).
Prostate cancer represents one of the most striking disparities, with Black men 64 percent more likely to be diagnosed than White men and twice as likely to die from the disease (see Table 1). Although prostate cancer mortality has declined in recent years overall, Black men continue to experience the highest mortality from prostate cancer of any racial or ethnic group. Research efforts are underway to better understand the biological and nonbiological factors contributing to the disproportionate burden of prostate cancer among Black men (see Research-focused Approaches).
Compared to women of all other racial and ethnic groups, Black women have approximately two-fold higher incidence rates of triple-negative breast cancer, an aggressive subtype associated with poorer prognosis (31)Giaquinto AN, et al. (2024) CA Cancer J Clin, 74: 477. . Black women also have higher uterine cancer incidence and mortality rates compared to those of White women (see Table 1). Stomach cancer and multiple myeloma also show marked disparities, with Black individuals experiencing approximately two-fold higher incidence and mortality rates than White individuals.
The US Black population includes individuals born in the United States as well as those who have immigrated to the country and trace their ancestral roots to the diverse Black populations of the African diaspora. Significant heterogeneity in cancer burden exists within these subgroups, in part, because of differences in exposure to cancer risk factors as well as social drivers of health (SDOH) (see Understanding and Addressing Drivers of Cancer Disparities). National data show that US-born Black individuals experience higher cancer mortality than non–US-born Black individuals, both overall and across nearly all major cancer types (49)Abubakar AK, et al. (2025) Cancer Epidemiol Biomarkers Prev, 34: 1341. (50)Yu M, et al. (2024) J Natl Cancer Inst, 116: 1145. . For example, lung cancer mortality rates are more than three-fold higher among US-born Black individuals than among their non–US-born counterparts (50)Yu M, et al. (2024) J Natl Cancer Inst, 116: 1145. . Consistent with these patterns, a population-based study of breast cancer outcomes in Florida demonstrated substantial heterogeneity within the Black population by nativity. US-born Black women with breast cancer had a higher risk of death than Caribbean-born Black women (23)Sanchez-Covarrubias AP, et al. (2025) Lancet Reg Health Am, 52: 101292. . Notably, outcomes varied within Caribbean subgroups by country of birth; compared to US-born Black women with breast cancer, Cuban-, Dominican-, and Jamaican-born Black women had a lower risk of death, whereas no significant difference was observed for Haitian-born women (23)Sanchez-Covarrubias AP, et al. (2025) Lancet Reg Health Am, 52: 101292. .
The persistent disparities in cancer burden experienced by Black populations are rooted in long-standing structural inequities that shape social and economic conditions, health behaviors, and access to care. Structural racism has influenced where people live, the quality of education and employment opportunities available to them, and access to and receipt of affordable, high-quality evidence-based health care. These factors contribute to disproportionately higher exposure to cancer risk factors and barriers to prevention, early detection, treatment, and survivorship care. Addressing these disparities will require systems-level interventions that expand access to prevention and screening, improve care delivery, and ensure receipt of evidence-based treatment (see Understanding and Addressing Drivers of Cancer Disparities).
Hispanic Population
| At A Glance: Hispanic Population |
| Number and proportion of the US population†: 62.1 million people or 18.7 percent New cancer cases†: 177,254 Cancer deaths‡: 48,217 Most common cancers§: Female breast, prostate, and colorectal cancers Most common causes of cancer deaths§: Prostate, lung and bronchus, and female breast cancers |
* Based on the Census 2020. Numbers shown are for those who identified as Hispanic ethnicity alone or in combination with any race.
† Data indicate reported numbers of new cases for 2022 in the Hispanic population.
‡ Data indicate reported numbers of cancer deaths for 2023 in the Hispanic population.
§ Most common cancers were identified based on sites with the highest age-adjusted incidence (2018–2022) and mortality (2019–2023) rates.
Source: (8).
The Hispanic population is one of the fastest-growing and most diverse ethnic groups in the United States, representing many races, religions, languages, countries of origin, and cultural identities. However, most US cancer data for the Hispanic population are reported in aggregate, masking important differences in cancer incidence and mortality rates across diverse subgroups within the population (see Sidebar 4). Hispanic individuals in the United States have a higher life expectancy than White individuals, despite having lower incomes, limited access to health care, and greater exposure to certain risk factors, a phenomenon known as the “Hispanic Paradox” (51)Fernandez J, et al. (2023) Journal of Economic Perspectives, 37: 145. (52)Trejo BG, et al. (2024) BMJ Public Health, 2: e001191. . Comprehensive, disaggregated data on cancer incidence and mortality are essential for understanding the true burden of cancer and related disparities within this population (see Sidebar 4).
Recent data show that Hispanic populations have the second lowest overall rates of cancer incidence and mortality of any US racial or ethnic group (see Table 1). However, the Hispanic population bears a disproportionately higher burden of certain cancers, particularly those associated with infectious agents, such as liver and stomach cancers (see Disparities in the Burden of Modifiable Behavioral Cancer Risk Factors). For example, incidence rates (2019–2023) of stomach cancer were 82 percent higher and mortality rates (2020–2024) were more than twice as high among Hispanic individuals than among White individuals (see Table 1). Hispanic individuals also had a 97 percent higher incidence of liver cancer and a 46 percent higher mortality from liver cancer than White individuals. In addition, one study found that, between 2011 and 2020, Hispanic individuals experienced the largest increases in early-onset CRC incidence, with annual increases of 4.7 percent among women and 3.5 percent among men, compared to 2.1 percent and 2.7 percent, respectively, among White women and men (53)Gupta A, et al. (2024) Cancer Epidemiol, 92: 102632. . Hispanic individuals are also less likely than White individuals to be diagnosed with localized (early-stage) cancers, in part due to lower screening rates (see Disparities in Cancer Screening for Early Detection) (54)American Cancer Society. Cancer Facts and Figures for Hispanic/Latino People 2024-2026. Accessed: April 4, 2026. .
Cervical cancer continues to disproportionately affect Hispanic women compared to White women. During 2019–2023, cervical cancer incidence rates were 47 percent higher among Hispanic women than among White women. Although the disparity in mortality from cervical cancer has narrowed in recent decades, Hispanic women are still 12 percent more likely to die from the disease, compared to White women (see Figure 1 and Table 1).
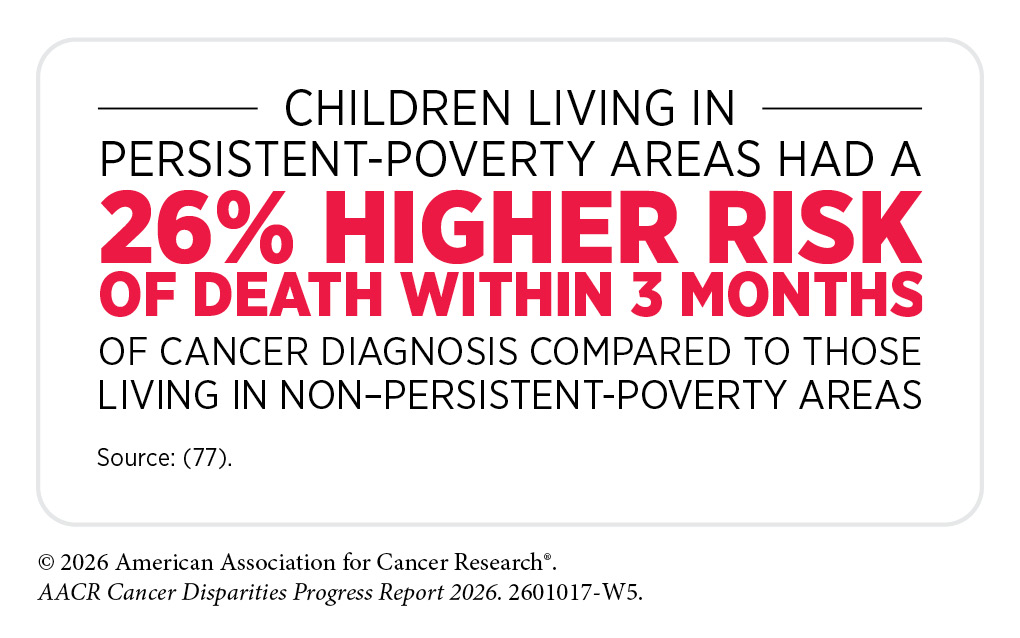
Hispanic children and adolescents also shoulder a disproportionate burden of certain cancers. Despite lower overall cancer incidence, Hispanic children and adolescents have higher incidence of leukemia and germ cell tumors than their White counterparts (54)American Cancer Society. Cancer Facts and Figures for Hispanic/Latino People 2024-2026. Accessed: April 4, 2026. . For example, lymphoid leukemia incidence is 28 percent higher in Hispanic children and nearly two-fold higher in Hispanic adolescents compared to their White counterparts. Similarly, germ cell tumor incidence is 35 percent higher in Hispanic children and 63 percent higher in Hispanic adolescents compared to White children and adolescents. Hispanic children and adolescents also experience disparities in cancer survival. A recent population-based study found that Hispanic pediatric cancer patients had a 42 percent higher risk of death within the first year after diagnosis compared to their White counterparts (55)Preuss K, et al. (2025) Pediatr Blood Cancer, 72: e31520. .
The US Hispanic population comprises nearly two dozen subgroups based on country of origin and cultural heritage, among other factors. According to the 2020 US Census, eight Hispanic groups reached a population of one million or more, with the Mexican population constituting the largest subgroup of Hispanic individuals. Cancer burden differs significantly within the Hispanic subgroups, largely attributable to country of origin, immigration generation, possible differences in ancestral origins, and the length of time in the United States.
A recent study examining cancer mortality among disaggregated Hispanic population groups in the United States found substantial heterogeneity in cancer burden by country of origin and nativity (56)He Y, et al. (2024) Cancer Epidemiol Biomarkers Prev, 33: 1598. . For example, US-born Mexican individuals experienced significantly higher mortality from several major cancers compared to their Mexican-born counterparts, including two-fold higher mortality from liver cancer, 51 percent higher mortality from CRC, and 10 percent higher mortality from pancreatic cancer during 2013–2017. In contrast, Hispanic individuals born in Puerto Rico, Cuba, and Central or South America generally experienced higher cancer mortality than their US-born counterparts. For example, during the same time period, US-born Cuban men had 65 percent lower mortality from prostate cancer and US-born Cuban women had 57 percent lower mortality from ovarian cancer compared to their Cuban-born counterparts. Similarly, Puerto Rican individuals born in the US territory experienced substantially lower mortality from several cancers compared to individuals born in Puerto Rico, including approximately 40 percent lower mortality from liver cancer and 53 percent lower mortality from prostate cancer during 2013–2017 (56)He Y, et al. (2024) Cancer Epidemiol Biomarkers Prev, 33: 1598. . Additional differences in prostate cancer outcomes have also been observed among Hispanic patients by nativity, with those born outside the United States demonstrating improved survival compared to their US-born counterparts, despite presenting with more advanced stage disease at diagnosis (57)Freedland AR, et al. (2024) Cancer Epidemiol Biomarkers Prev, 33: 1512. .
Differences in cancer burden within Hispanic populations are also evident among individuals residing in Puerto Rico. During 2017–2021, prostate cancer incidence was more than 50 percent higher among Puerto Rican men than among other US Hispanic men and 23 percent higher than among White men (54)American Cancer Society. Cancer Facts and Figures for Hispanic/Latino People 2024-2026. Accessed: April 4, 2026. . Similarly, during 2017–2021, cervical cancer incidence rates among women in Puerto Rico were approximately 18 percent and 61 percent higher compared to Hispanic and White women, respectively, in the US (54).
The reasons for disparities in cancer burden faced by the Hispanic population are manifold. Adverse SDOH have led to higher prevalence of cancer-causing infections, obesity, poor diet quality, sedentary lifestyle, and lack of access to quality health care, all of which may interact with inherited genetic variation and other biological factors, contributing to cancer disparities (see Disparities in the Burden of Modifiable Behavioral Cancer Risk Factors) (58)Fejerman L, et al. (2022) Cancer Epidemiol Biomarkers Prev, 31: 932. . In addition, occupational and environmental exposures, including those associated with agricultural work and pesticide use, may further contribute to cancer risk in some Hispanic populations (see Understanding and Addressing Drivers of Cancer Disparities). Systems-level factors, such as differences in access to and receipt of evidence-based care across geographic areas and care settings, also play an important and modifiable role in shaping cancer outcomes (see Disparities in Clinical Research and Cancer Treatment).
Native Hawaiian or Pacific Islander (NHPI) Population
| At A Glance: Native Hawaiian or Pacific Islander Population |
| Number and proportion of the US population*: Estimated 622,018 people or 0.19 percent State of Hawai‘i New cancer cases†: 8,165 Cancer deaths‡: 2,576 Most common cancers§: Female breast, prostate, and colorectal cancers Most common causes of cancer deaths§: Lung and bronchus, prostate, and female breast cancers US-affiliated Pacific Islands (2007–2020)# New cancer cases: 9,079 Cancer deaths¶: N/A Most common cancers: Female breast, lung and bronchus, and colon and rectum cancers Most common causes of cancer deaths¶: N/A |
* Based on the Census 2020.
† Data indicate reported numbers of new cases for 2022 in the state of Hawai‘i.
‡ Data indicate reported numbers of cancer deaths for 2023 in the state of Hawai‘i.
§ Most common cancers were identified based on sites with the highest age-adjusted incidence (2018–2022) and mortality (2019–2023) rates in the state of Hawai‘i.
# Based on data from the Cancer in the US Affiliated Pacific Islands, 2007–2022 report.
¶ N/A: not available. The report does not document cancer mortality rates due to ongoing challenges with reporting and recording of deaths in the US-affiliated Pacific Islands.
Sources: Refs. 8,59,60.
The Native Hawaiian or Pacific Islander (NHPI) population includes more than 25 diverse groups with distinct variations in historical backgrounds, languages, immigration and colonization experiences, and cultural traditions. The NHPI racial group includes individuals with origins in any of the original peoples of Hawai‘i and the six US-affiliated Pacific Island jurisdictions: Guam, American Samoa, the Commonwealth of the Northern Mariana Islands, the Republic of the Marshall Islands, the Republic of Belau, and the Federated States of Micronesia.
In its 1997 mandate, the Office of Management and Budget (OMB) separated the API category into two distinct racial groups. However, the National Center for Health Statistics did not begin releasing disaggregated mortality data until 2018, when all states had implemented the updated classification on death certificates. Although this change improved the availability of disaggregated cancer mortality data for Asian American and NHPI populations, cancer incidence rates remain aggregated for these groups in most national cancer data sources. Because the NHPI population is much smaller than the Asian population (0.2 percent vs. 5.9 percent, respectively, of the US population in 2020), aggregated API data can mask the true cancer burden in the NHPI population (see Sidebar 4).
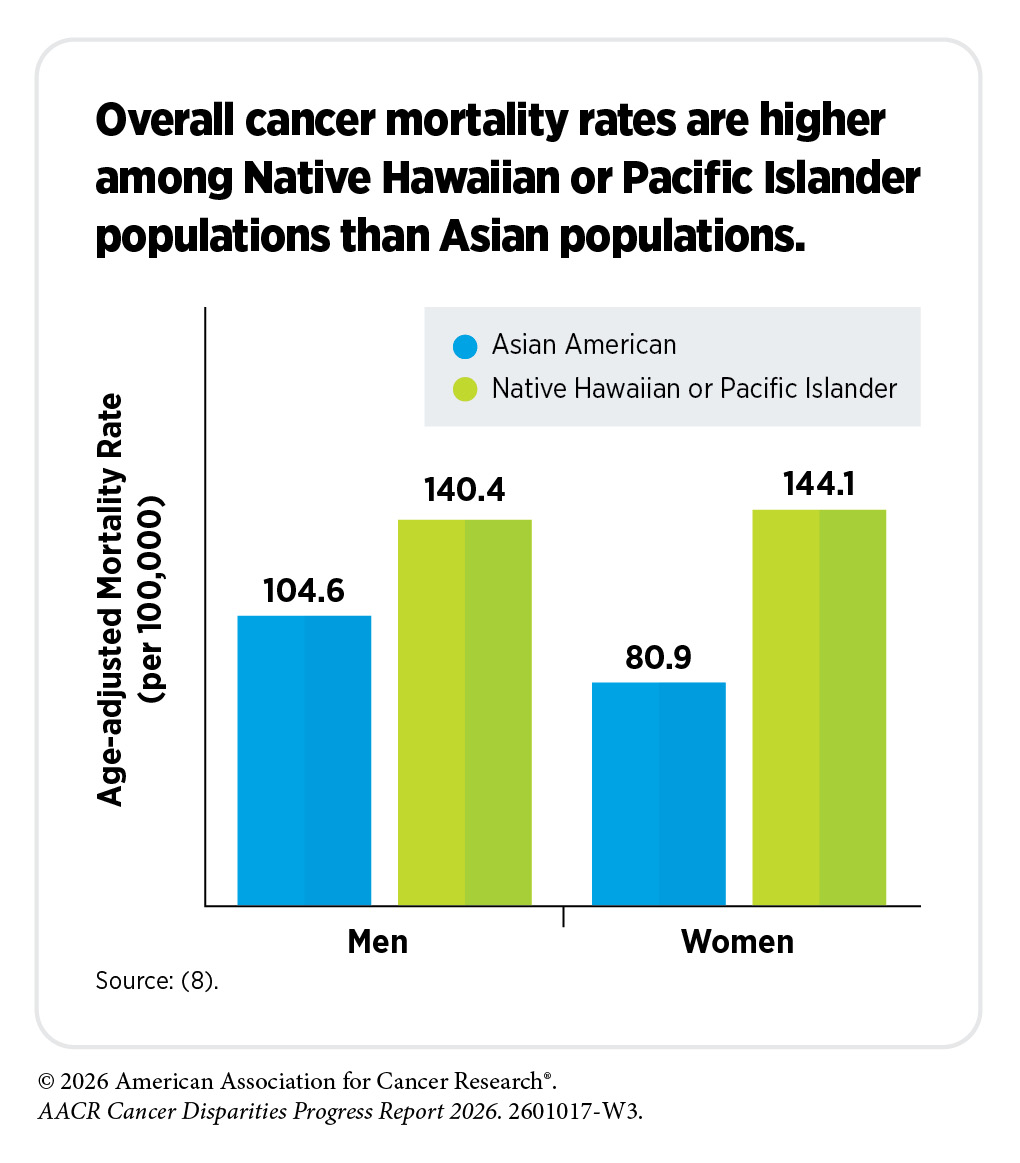
Aggregated data show that breast cancer mortality rates during 2020–2024 were 38 percent lower among API women than among White women. However, disaggregated data reveal substantial differences in disease burden between Asian and NHPI populations. Compared to White women, breast cancer mortality rates were 41 percent lower among Asian American women, yet 26 percent higher among NHPI women (8)Centers for Disease Control and Prevention. Cancer Statistics At a Glance. Accessed: March 17, 2026. . Similar patterns are observed for uterine cancer. Compared to White women, uterine cancer mortality rates during 2020–2024 were approximately 30 percent lower among API women (see Table 1). However, disaggregated mortality data show that uterine cancer mortality rates were 27 percent lower among Asian American women and nearly three-fold higher among NHPI women, compared to White women (8)Centers for Disease Control and Prevention. Cancer Statistics At a Glance. Accessed: March 17, 2026. .
Hawai‘i has the highest proportion of NHPI individuals of any US state. According to 2020 US Census Bureau estimates, 394,102 NHPI individuals (alone or in combination) reside in Hawai‘i, representing 27.1 percent of the state’s population. Hawai‘i residents generally experience a lower overall cancer burden compared to the US national average, frequently ranking among the states with the lowest age-adjusted incidence and mortality rates for all cancers combined. However, the burden of certain cancer types, such as stomach cancer, are substantially higher in the population of Hawai‘i. For example, during 2018–2022, stomach cancer incidence rates were 20 percent higher among women and 15 percent higher among men in Hawai‘i than among residents of the United States (see Table 2). Similarly, during 2020–2024, stomach cancer mortality rates were 7 percent higher among women and 13 percent higher among men in Hawai‘i compared to women and men in the United States overall (7)SEER*Stat Database: Mortality – All COD, Aggregated With State, Total U.S. (1990-2023) , National Cancer Institute, DCCPS, Surveillance Research Program, released February 2025..
Considerable disparities also exist based on racial and ethnic origin and geographic location of residence among individuals living in the state of Hawai‘i. For example, the overall cancer mortality is highest in Native Hawaiian individuals compared to other populations in the state. Similarly, Native Hawaiian women have the highest mortality from, and second highest incidence of, invasive breast cancer compared to Chinese, Filipino, White, and other Asian women living in Hawai‘i (60)University of Hawai‘i Cancer Center. Hawai‘i Cancer at a Glance 2014-2018. Accessed: March 17, 2026. . Another example is the disparate burden of cancer among residents of different Hawaiian Islands. As one example, residents of Hawai‘i County have the second lowest rate of overall cancer incidence, but the highest rate of cancer mortality, compared to those living in other counties (60)University of Hawai‘i Cancer Center. Hawai‘i Cancer at a Glance 2014-2018. Accessed: March 17, 2026. .
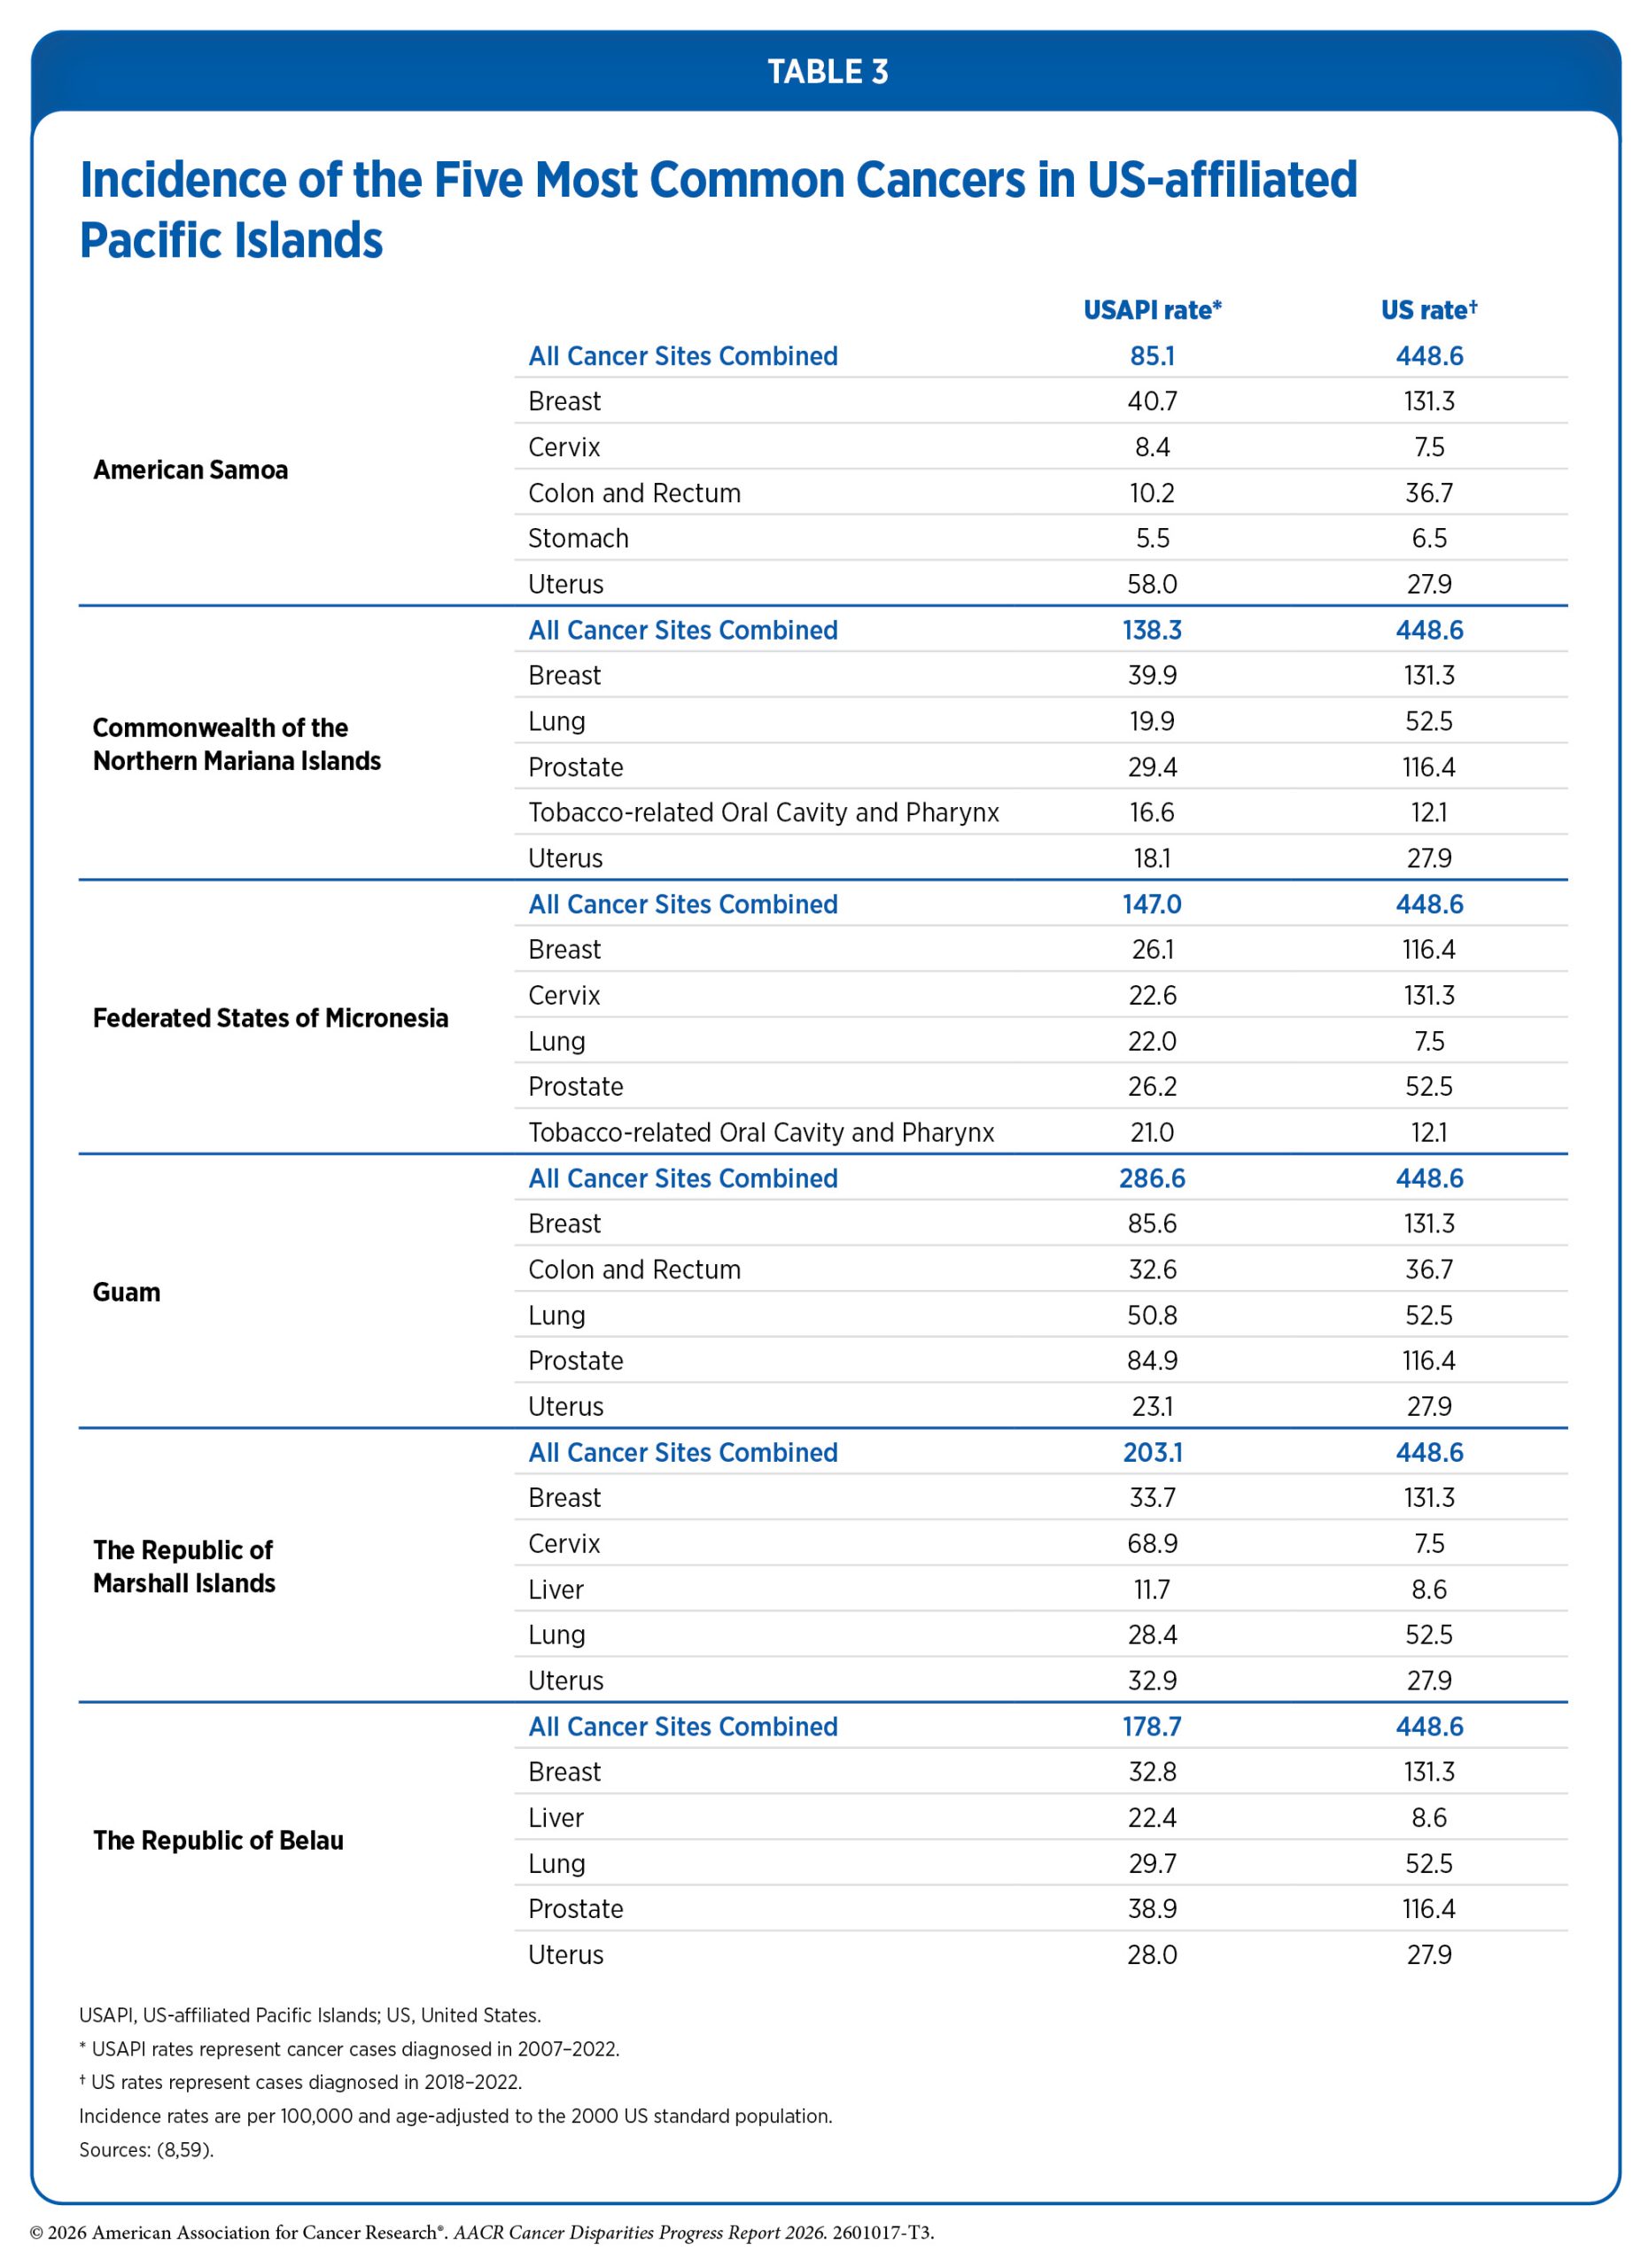
According to a recent report, Cancer in the US Affiliated Pacific Islands 2007–2022, released in 2025 by the Pacific Regional Central Cancer Registry, the incidence rate for all cancers combined in the US-affiliated Pacific Islands (USAPI) population during 2007–2022 was more than 50 percent lower than that of the US population (14)SEER*Stat Database: NAACCR Incidence Data – CiNA Research Data, 1995-2022, Public Use (19 Age Groups) (which includes data from CDC’s National Program of Cancer Registries (NPCR), CCR’s Provincial and Territorial Registries, and the NCI’s Surveillance, Epidemiology and End Results (SEER) Registries), submitted December 2024(59)Pacific Regional Central Cancer Registry. Cancer in the U.S. Affiliated Pacific Islands 2007-2022. Accessed: March 17, 2026. . Incidence rates for nearly all major cancer types, including cancers of the lung and bronchus, female breast, and colorectum, were lower in the USAPI population than in the mainland US population. The only exceptions were cervical and liver cancers. Cervical cancer incidence rates were more than two-fold higher in the USAPI population than in the US population (17.2 vs. 7.5 cases per 100,000). Liver cancer incidence rates were also higher in the USAPI population than in the US population, although differences were less pronounced (10.9 vs. 8.6 cases per 100,000) (59)Pacific Regional Central Cancer Registry. Cancer in the U.S. Affiliated Pacific Islands 2007-2022. Accessed: March 17, 2026. . Despite the overall lower incidence rates in the aggregated USAPI population, there were substantial disparities among populations living in various USAPI (see Table 3).
Notably, reported cancer incidence rates may not fully reflect the true cancer burden in this population due to limitations in cancer surveillance systems, diagnostic capacity, and health care infrastructure in some USAPIs. Furthermore, the Cancer in the US Affiliated Pacific Islands 2007–2022 report does not include cancer mortality rates due to ongoing challenges with the reporting and recording of deaths in the USAPI. Nevertheless, substantial differences among various USAPI populations exist in 5-year relative survival rates for several cancer types. For example, the 5-year relative survival rate for cervical cancer among women living in the Republic of Palau is about half that of those living in the Commonwealth of the Northern Mariana Islands (47 percent vs. 84 percent, respectively), even though the age-standardized incidence of cervical cancer is almost similar (12.8 vs. 11.8 cases per 100,000, respectively) (59)Pacific Regional Central Cancer Registry. Cancer in the U.S. Affiliated Pacific Islands 2007-2022. Accessed: March 17, 2026. .
The increasing prevalence of sedentary lifestyle, poor nutrition, and tobacco use among the NHPI population is a key driver of cancer disparities (see Disparities in the Burden of Modifiable Behavioral Cancer Risk Factors). Furthermore, geographic location, socioeconomic characteristics, and limited health care infrastructure in many USAPIs present unique structural barriers to accessing quality health care, including clinical trials (see Disparities in Clinical Research and Cancer Treatment), cancer screening and diagnostic services (see Disparities in Cancer Screening for Early Detection), and specialized cancer care, contributing to underdiagnosis and suboptimal clinical care and exacerbating the disproportionate cancer burden in this population.
Cancer Disparities Experienced by Other Medically Underserved Populations
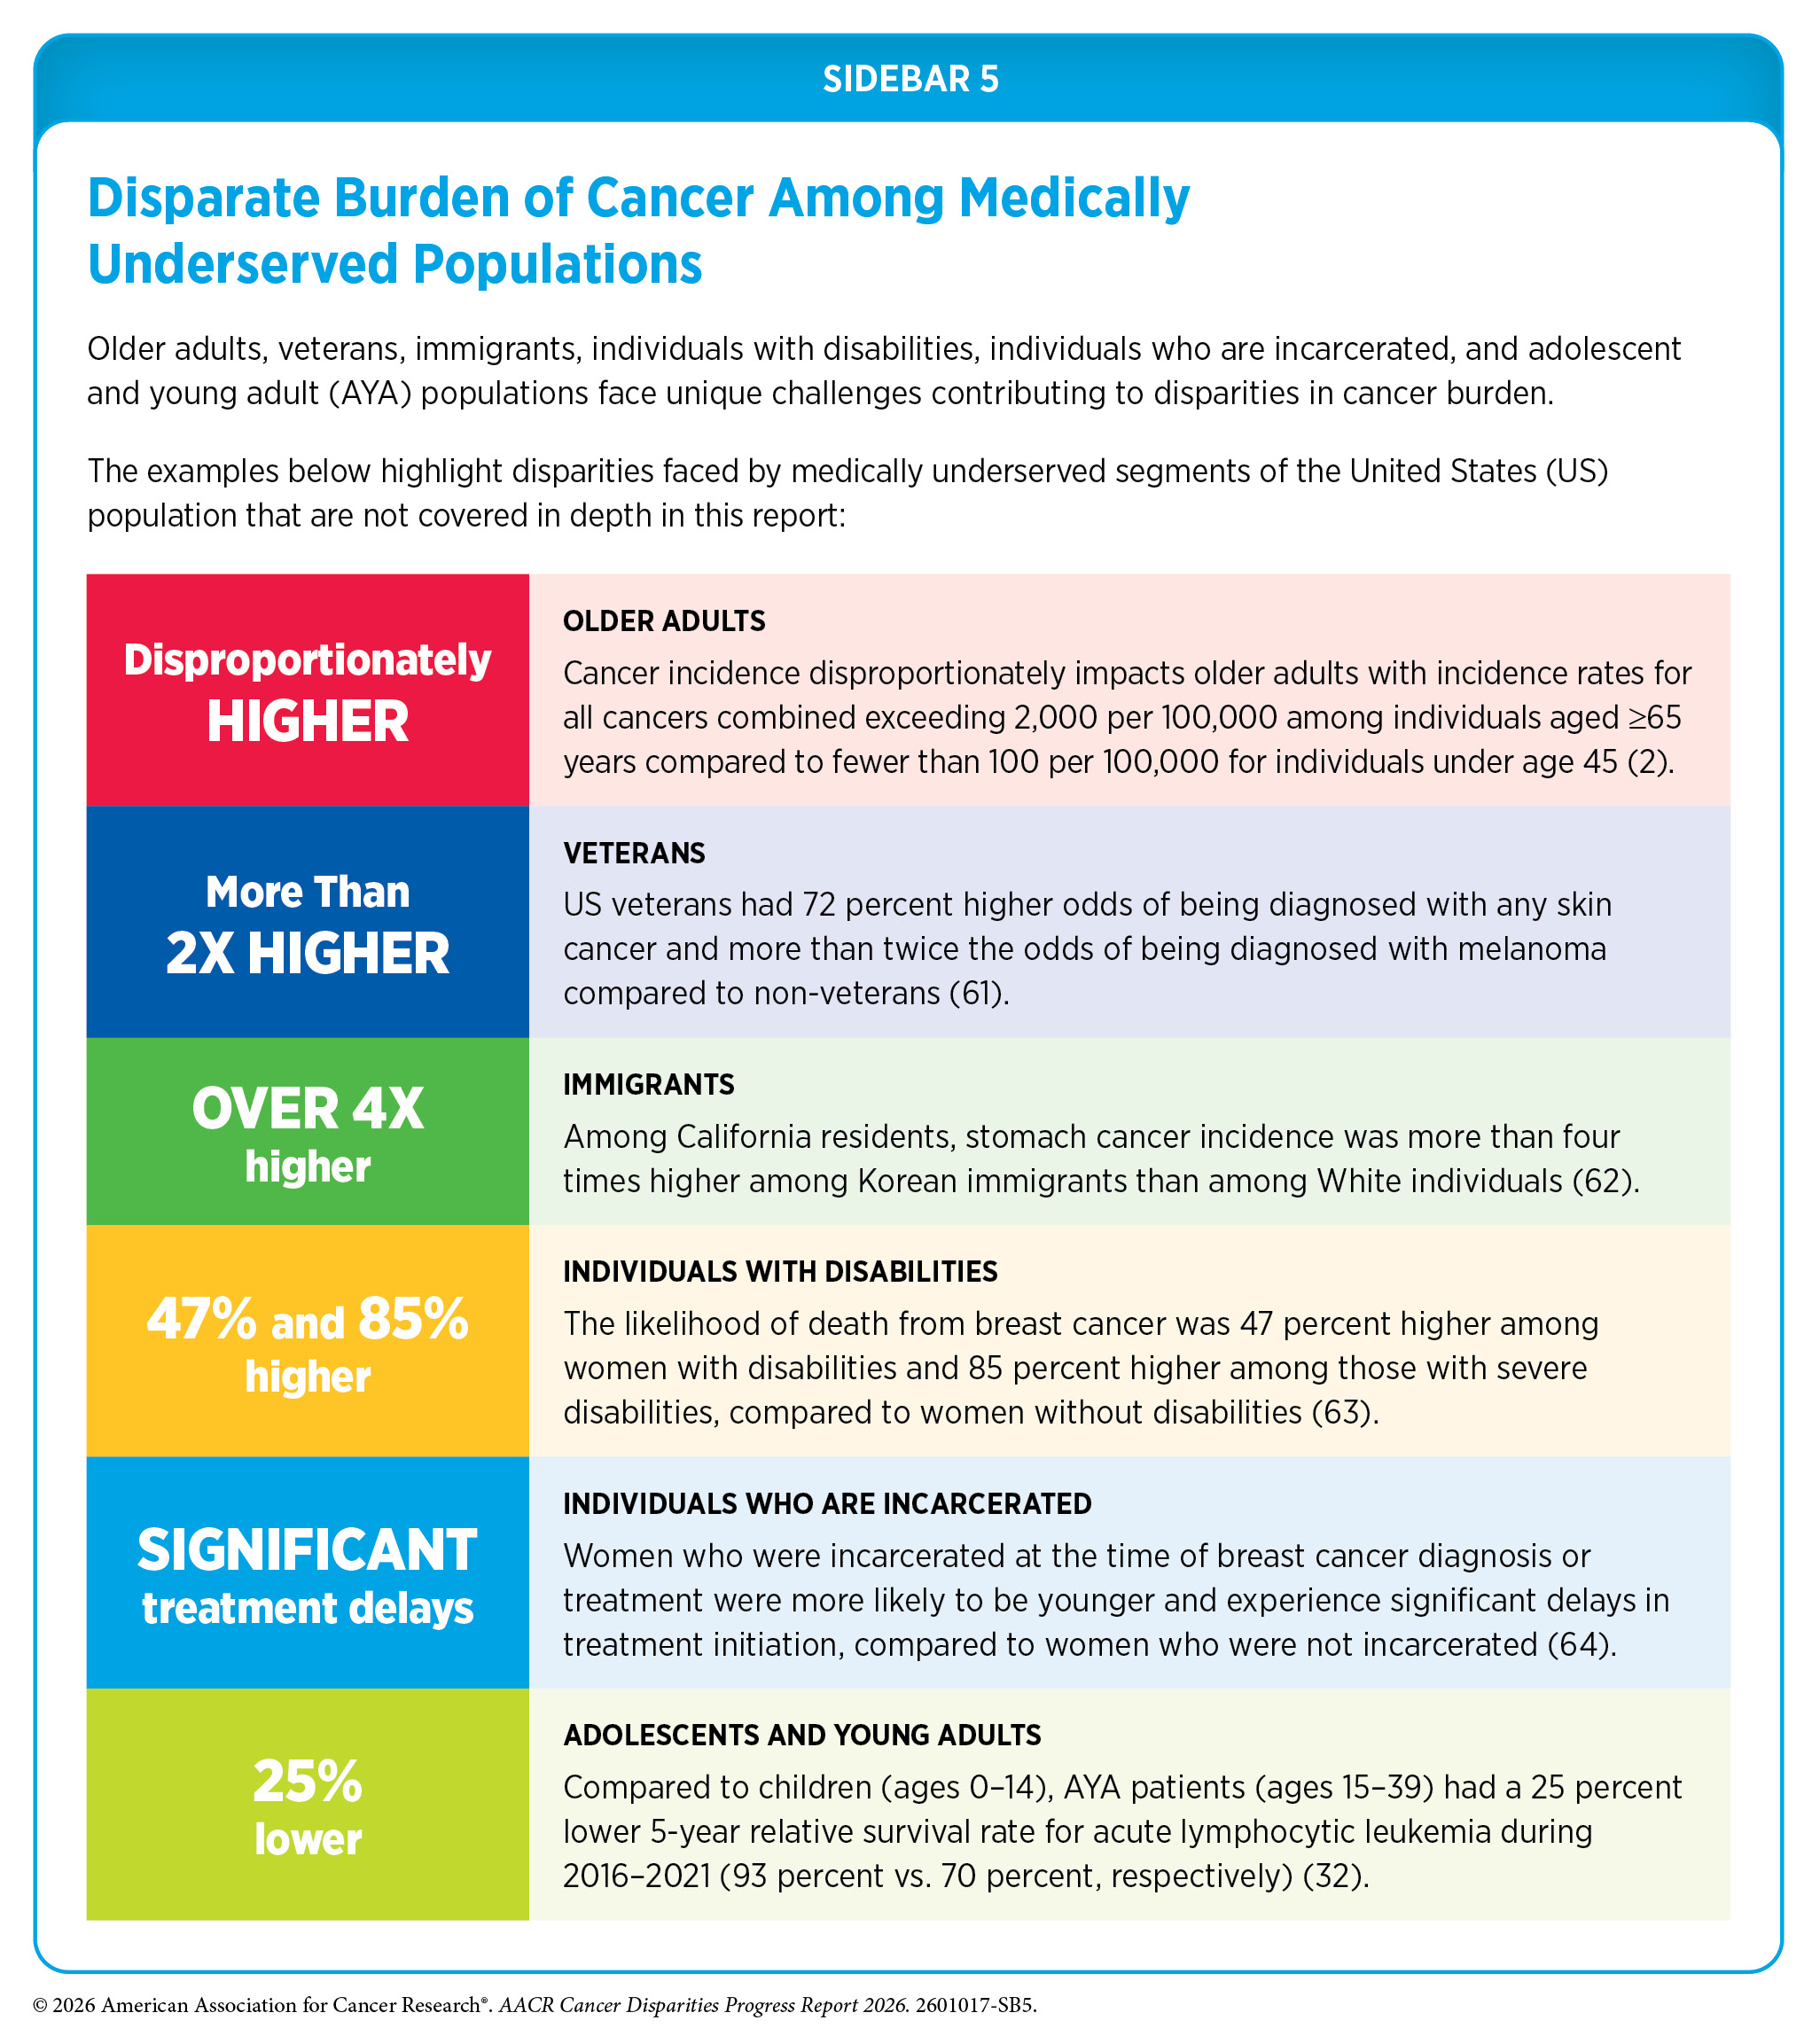
In addition to racial and ethnic minority groups, many segments of the US population remain medically underserved and shoulder a disproportionate burden of cancer. Factors that contribute to disparities in these populations include lack of access to quality cancer care, a higher prevalence of certain modifiable risk factors, residence in remote areas, barriers arising due to sexual orientation and gender identity, and persistent poverty. In addition, other populations such as older adults, veterans, immigrants, individuals with disabilities, individuals who are incarcerated, and adolescents and young adults (AYAs) face unique challenges that contribute to disparities in cancer risk, access to care, and outcomes (see Sidebar 5).
Populations Residing in Rural Areas
Multiple criteria distinguish rural or nonmetropolitan areas from urban or metropolitan counties. Based on the 2023 Rural-Urban Continuum Codes developed by the US Department of Agriculture Economic Research Services, an estimated 15 percent of the US population and 74 percent of US counties are located in rural or nonmetropolitan areas (65)US Department of Agriculture. Economic Research Service. Rural-Urban Continuum Codes. Accessed: March 17, 2026. . Although less racially and ethnically diverse than populations in urban or metropolitan counties, rural populations tend to have lower socioeconomic status and face unique challenges in access to quality cancer care, prevention, and screening. According to a recent study, between 2015 and 2019, approximately 18 percent of all US cancer cases were diagnosed in rural populations (66)Semprini J, et al. (2024) Cancer Epidemiol Biomarkers Prev, 33: 1012. .
According to recent data, the overall cancer incidence (2019–2023) and mortality (2020–2024) rates were 6 percent and 18 percent higher, respectively, among residents of nonmetropolitan or rural areas compared to those living in metropolitan or urban areas (2)SEER*Explorer: An interactive website for SEER cancer statistics [Internet]. Surveillance Research Program, National Cancer Institute; 2026 Apr 22. [cited 2026 May 11]. Data source(s): SEER Incidence Data, November 2025 Submission (1975-2023), SEER 21 registries. . These disparities are even more pronounced for certain cancer types. For example, incidence rates during 2019–2023 were 37 percent higher for lung cancer, 26 percent higher for cervical cancer, and 17 percent higher for CRC in rural areas compared to urban areas. Similarly, during 2020–2024, mortality rates for CRC, cervical cancer and lung cancer were 27 percent, 32 percent, and 36 percent higher, respectively, in rural areas than in urban areas (2)SEER*Explorer: An interactive website for SEER cancer statistics [Internet]. Surveillance Research Program, National Cancer Institute; 2026 Apr 22. [cited 2026 May 11]. Data source(s): SEER Incidence Data, November 2025 Submission (1975-2023), SEER 21 registries. . Notably, women living in rural areas have lower breast cancer incidence rates, but higher breast cancer mortality rates than women living in urban areas.
Cancer mortality disparities between rural and urban populations in the United States have widened substantially over time. While large metropolitan areas had the highest overall cancer mortality rates in 1969–1971, this pattern has reversed over the past five decades, with rural populations experiencing the highest cancer death rates in 2021–2023 (67)Islami F, et al. (2026) J Natl Cancer Inst. . This reversal of trends occurred in the 1990s and 2000s, and the rural-urban gap in cancer mortality has continued to widen in subsequent years, driven in part by slower declines in rural areas compared to large metropolitan areas (67,68). Importantly, these patterns are evident across multiple major cancer types. For example, lung cancer mortality rates in rural men and women were 26 percent and 35 percent lower, respectively, compared to those in large metropolitan areas in 1969–1971, but were 55 percent and 47 percent higher, respectively, by 2021–2023 (67)Islami F, et al. (2026) J Natl Cancer Inst. .
Intersectionality encompasses the complex ways in which the effects of multiple forms of discrimination (such as racism, sexism, and classism) combine, overlap, or intersect, especially in the lived experiences of marginalized individuals or groups, and is an important consideration when discussing the burden of cancer in medically underserved populations, including rural residents. Recent evidence demonstrates that these intersecting factors contribute to compounded disparities in cancer outcomes. For example, a study examining differences in 5-year cancer survival by race and ethnicity, urban–rural residence, and stage at diagnosis found that survival was lower among both Black individuals and residents of nonmetropolitan areas, with the lowest survival observed among Black individuals residing in nonmetropolitan areas; these patterns were consistent across all stages of disease (69)Islami F, et al. (2025) Cancer, 131: e70073. .
Importantly, the magnitude of rurality varies substantially across geographic contexts. In the continental United States, rural populations are often defined by lower population density and distance from metropolitan areas; however, in regions such as Alaska and the USAPIs, geographic isolation can be far more extreme. In these settings, communities may be separated by vast distances and limited transportation infrastructure, with some areas accessible only by air or water. These differences in scale and geography can further constrain access to cancer prevention, screening, and treatment services and contribute to unique and compounded disparities in cancer outcomes. To better capture these differences, novel approaches, such as the Integrated Metropolitan-to-Frontier Area Codes (IMFAC) classification, integrate population density and geographic isolation to better reflect differences in community size, distribution, and degree of isolation, providing a more precise framework for assessing disparities in health outcomes and access to care across the United States (70)Gibson BJ, et al. (2025) J Rural Health, 41: e70102. .
It is important to note that 85 percent of counties experiencing persistent poverty are rural (71)National Cancer Institute. Division of Cancer Control and Population Sciences. Persistent Poverty. Accessed: March 31, 2026. . Because of these sociodemographic characteristics, people living in rural areas have fewer opportunities to improve their socioeconomic status; experience higher exposure to certain environmental and other cancer risk factors; have limited access to high-speed Internet; and face barriers to accessing health care, particularly specialized cancer care, including care at NCI-designated cancer centers (see Understanding and Addressing Drivers of Cancer Disparities) (72)Unger JM, et al. (2025) CA Cancer J Clin, 75: 341. .
Populations Living in Persistent-poverty Areas
Persistent poverty is a place-based measure of long-term economic disadvantage, commonly defined as counties or census tracts in which 20 percent or more of the population has lived in poverty for at least three decades. Unlike measures of short-term or individual-level poverty, persistent poverty captures the cumulative effects of sustained underinvestment and structural disadvantage at the community level. According to a recent US Census Bureau report, approximately 11 percent of US counties are classified as being in persistent poverty, and more than 80 percent of these counties are located in the Southern United States (73)Census.gov. Persistent Poverty in Counties and Census Tracts. Accessed: March 17, 2024. .
For multiple cancer types, populations living in persistent poverty areas experience worse outcomes across the cancer continuum, including higher incidence, more advanced stage at diagnosis, and higher mortality. For example, a recent national analysis found that women living in counties with persistent poverty had 32 percent higher cervical cancer incidence and 49 percent higher cervical cancer mortality rates compared to women living in non–persistent-poverty areas (74)Dorali P, et al. (2025) JNCI Cancer Spectr, 9. . Similar patterns have been observed across other cancer types. In a study of oral cavity and pharyngeal cancers, individuals residing in persistent-poverty census tracts had 14 percent higher incidence rates, were 24 percent more likely to be diagnosed with advanced-stage disease, and had a 30 percent higher risk of all-cause mortality compared to those living in non–persistent-poverty areas (75)Karanth S, et al. (2024) Cancer Causes Control, 35: 1063. . In addition, among women with breast cancer, those living in persistently impoverished neighborhoods were more likely to present with more aggressive tumor characteristics, including higher-grade disease, triple-negative subtype, and advanced stage at diagnosis (76)Chen JC, et al. (2024) JAMA Netw Open, 7: e2427755. ). Women residing in persistent-poverty areas also had a 10 percent higher risk of breast cancer–specific mortality and a 13 percent higher risk of all-cause mortality, compared to those living in areas without persistent poverty.
Studies also suggest that increasing levels of persistent poverty are associated with progressively worse cancer outcomes. For example, in an analysis of cervical cancer, women living in counties with extreme persistent poverty, defined as areas where at least 40 percent of residents live below the poverty level, had more than 1.6-fold higher cervical cancer incidence and nearly double the cervical cancer mortality compared to women living in non–persistent-poverty areas (74)Dorali P, et al. (2025) JNCI Cancer Spectr, 9. . By comparison, women living in counties with lower levels of persistent poverty (up to 30 percent of residents living in poverty) also had higher cervical cancer incidence and mortality, although to a lesser extent than those living in extreme persistent poverty. Similarly, individuals with colon cancer living in areas with higher concentrations of persistent poverty had a greater risk of disease-specific mortality compared to those living in areas with lower or no persistent poverty (78)Naar L, et al. (2026) JAMA Netw Open, 9: e2551212. .
The adverse effects of persistent poverty may be further amplified when they intersect with other forms of structural disadvantage, such as rurality. In an analysis of early-onset CRC, individuals living in rural areas alone had a 16 percent higher risk of death than those living in nonrural areas, whereas those living in both rural and persistent-poverty areas had a 30 percent higher risk of death than those living in nonrural, non–persistent-poverty areas (79)Tsai MH, et al. (2024) JAMA Netw Open, 7: e2430615. . Similarly, a national analysis found that counties that were both rural and experiencing persistent poverty had the highest rates of smoking, lung cancer incidence, and lung cancer mortality compared to urban, non–persistent-poverty areas (80)Bernacchi V, et al. (2025) BMC Public Health, 25: 878. .
Moreover, the association between rurality and lung cancer mortality was stronger in persistent-poverty areas than in non–persistent-poverty areas, underscoring the synergistic effects of these intersecting structural conditions. Collectively, these findings underscore the importance of considering intersecting socioeconomic and geographic factors when assessing and addressing cancer disparities.
Populations Identifying as Sexual and Gender Minority
Sexual and gender minority (SGM) is an all-inclusive term defined by the National Institutes of Health (NIH) and includes those who identify as lesbian, gay, bisexual, transgender, queer, intersex, asexual, and/or Two-Spirit; those with same-sex or same-gender attractions or behaviors; those with a difference in sex development; and those who do not self-identify with one of these terms but whose sexual orientation, gender identity or expression, or reproductive development is characterized by nonbinary constructs of sexual orientation, gender, and/or sex. According to a recent national survey, about 9 percent of the US population self-identifies as belonging to the SGM populations (81)Gallup. LGBTQ+ Identification in U.S. Rises to 9.3%. Accessed: March 31, 2026. .
Comprehensive and population-level information about cancer incidence and mortality among SGM individuals is limited because sexual orientation and gender identity (SOGI) data have not been routinely collected and documented in national cancer registries and other health records. In the absence of population-level data, this report relies on relatively small studies that highlight cancer disparities experienced by SGM individuals.
Emerging evidence suggests that the distribution of certain cancer types may differ between SGM and non-SGM populations. In a study of US women, overall cancer incidence did not differ significantly by sexual orientation; however, site-specific analyses showed that lesbian women had higher rates of certain cancers, including nearly two-fold higher incidence of thyroid cancer and non-Hodgkin lymphoma compared to heterosexual women (82)Huang AK, et al. (2024) Cancer, 130: 4306. . Similarly, analyses of electronic health record data from a large cancer center found that SGM patients were disproportionately represented among several cancer types, including blood cancers and cancers of the pancreas, kidney, thyroid, rectum, uterus, and ovaries, compared to non-SGM patients (83)Zamani SA, et al. (2025) J Natl Cancer Inst Monogr, 2025: 76. . Consistent with these findings, other studies have reported higher rates of cancers linked to HPV and human immunodeficiency virus (HIV) among SGM populations, including Kaposi sarcoma, anal cancer, and testicular cancer, compared to non-SGM populations (84)Simone NL, et al. (2025) J Natl Cancer Inst Monogr, 2025: 153. .
Evidence on prostate cancer disparities among SGM populations remains limited and inconclusive. Available studies do not consistently indicate that gay and bisexual men have a higher incidence of prostate cancer compared to heterosexual men (85)Yazdanpanah O, et al. (2023) Cancers (Basel), 15. . Transgender women, however, remain at risk of developing prostate cancer even after gender-affirming surgery because the prostate is typically retained. Transgender women receiving gender-affirming hormone therapy appear to have a lower risk of prostate cancer than cisgender men; however, emerging evidence suggests they may be more likely to present with aggressive disease and have poorer outcomes following diagnosis (86)Nik-Ahd F, et al. (2024) JAMA, 332: 335. . For example, in one study, gender-affirming hormone therapy was associated with increased likelihood of cancer recurrence and metastases (87)Manfredi C, et al. (2024) JAMA Oncol, 10: 1697. . Another study found that, compared to cisgender men, transgender women had approximately 60 percent lower risk of developing prostate cancer but nearly two-fold higher mortality following diagnosis (88)Manfredi C, et al. (2023) Curr Oncol Rep, 25: 1431. .
Skin cancer represents one of the few cancer types for which population-level data are available to assess disparities by sexual orientation. In a nationally representative study of US adults, gay and lesbian individuals had a 37 percent higher prevalence of nonmelanoma skin cancer compared to heterosexual individuals. Disparities were substantially larger among racial and ethnic minority populations, among whom gay and lesbian individuals had more than three-fold higher prevalence than their heterosexual counterparts (89)Schroeder EW, et al. (2025) Cancer Epidemiol Biomarkers Prev, 34: 2294. . Consistent findings have been reported in other large population-based studies. For example, a 2024 study found that lifetime prevalence of skin cancer was more than three-fold higher among Hispanic sexual minority men and more than two-fold higher among Black sexual minority men compared to their heterosexual counterparts (90)Rypka KJ, et al. (2024) JAMA Dermatol, 160: 977. . These findings underscore the importance of considering intersectionality when evaluating cancer disparities among SGM populations.
Examples discussed above highlight the urgent need for comprehensive SOGI data collection to accurately estimate cancer burden among SGM populations. In recent years, key partners across the health care continuum have accelerated large-scale efforts to address gaps arising from the lack of comprehensive data for certain populations, including SGM populations. One such effort is NIH’s All of Us Research Program, launched in 2018, which aims to recruit one million participants from diverse backgrounds to improve health outcomes for all patients (91)All of Us Research Program I, et al. (2019) N Engl J Med, 381: 668. . Findings from a study within this program, which included more than 30,000 SGM participants, showed that sexual minority men were 15 percent more likely, and sexual minority women were 12 percent less likely, to be diagnosed with cancer compared to their heterosexual counterparts (92)Tran NK, et al. (2023) JAMA Netw Open, 6: e2324969. . However, it is important to note that research initiatives such as All of Us rely on primary data collection, whereas cancer registry data are derived primarily from medical records. Therefore, expanding the collection of comprehensive SOGI data in cancer registries, along with continued research using population-level data, is essential to fully characterize cancer burden overall and by cancer type in SGM populations.
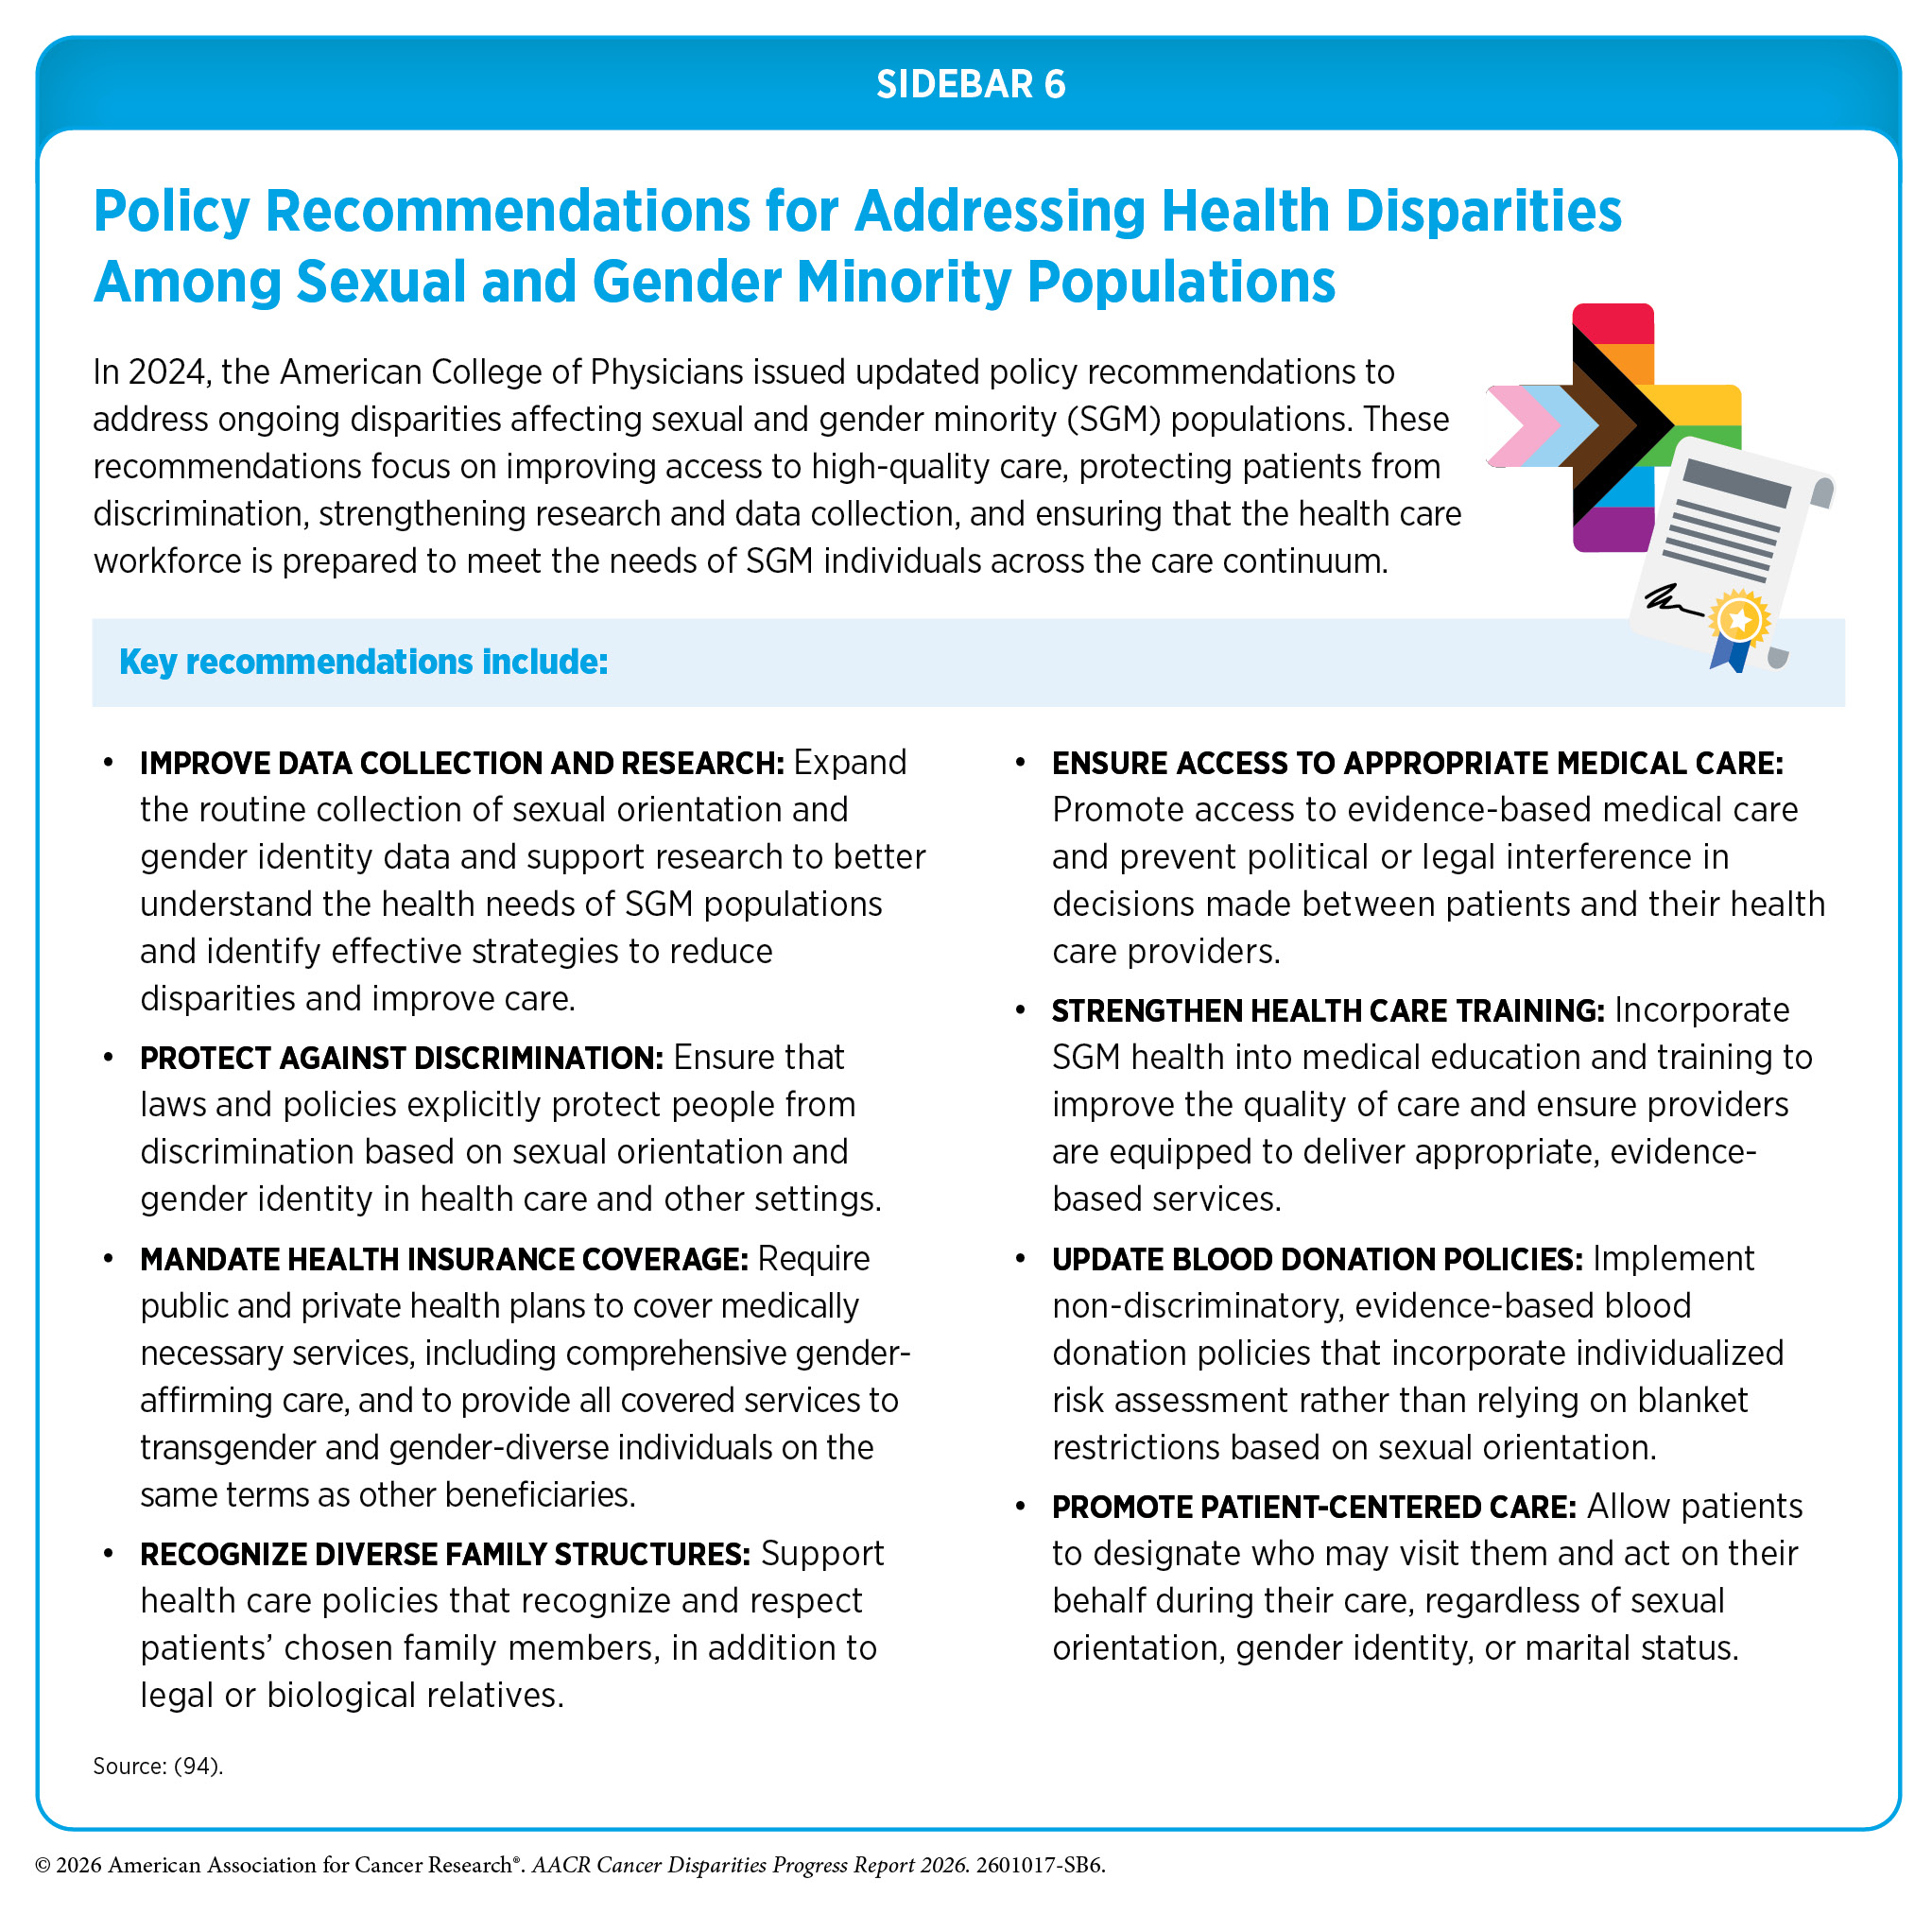
Recent federal actions and policy shifts have raised concerns about the continued collection, standardization, and accessibility of SOGI data across health care and public health systems. Sustained inclusion of SOGI measures in cancer surveillance, research, and registry data is critical for accurately monitoring cancer burden and advancing efforts to reduce disparities among SGM populations. Possible reasons for cancer disparities among SGM populations are numerous, including the higher prevalence of certain risk factors (such as tobacco and alcohol use), higher rates of human papillomavirus (HPV) and human immunodeficiency virus (HIV) infections, suboptimal uptake of cancer screening, a lack of knowledge among health care providers about SGM individuals’ health needs, and discrimination (93)Leone AG, et al. (2023) JAMA Oncol, 9: 556. . More work is needed to better understand and address these factors to reduce disparities in cancer burden among SGM populations (see Sidebar 6).
Achieving Health Equity: A Vital Investment for the US Public Health and Economy
Cancer and cancer disparities impose a substantial economic burden on individuals, families, communities, and society. In the United States, cancer care represents one of the most costly areas of health care, with total annual expenditures exceeding $236 billion, or approximately $129,500 per diagnosis (95)Ngo P, et al. (2026) J Natl Cancer Inst Monogr, 2026: 3. .
However, these costs are not evenly distributed; medically underserved populations bear a disproportionate share of the economic burden associated with cancer. For example, a study evaluating years of life lost due to gynecologic cancer in the United States revealed that women from racial or ethnic minority populations had a substantially higher number of potential years of life lost compared to White women (96)Kaur A, et al. (2023) Gynecol Oncol, 170: 266. . Similarly, another report evaluating cancers diagnosed in 2019 in the United States found that AYA populations, who are often uninsured or underinsured and face unique challenges after cancer diagnosis, had significantly higher lifetime costs of cancer (see Financial Challenges). The total lifetime economic burden in this population was estimated at $23.5 billion, including $3.2 billion in direct medical costs and $18.0 billion in lost productivity (97)Parsons SK, et al. (2023) J Clin Oncol, 41: 3260. .
Beyond the direct costs of cancer, broader analyses underscore the substantial economic impact of health disparities in the United States. A national analysis estimated that racial and ethnic health inequities cost the US economy an estimated $451 billion in 2018 due to excess medical costs, lost productivity, and premature death, while inequities related to educational attainment accounted for an additional $978 billion (98)LaVeist TA, et al. (2023) JAMA, 329: 1682. . These findings emphasize that addressing health disparities is not only a moral and public health imperative but also an economic necessity. Without sustained investment and coordinated action, progress toward eliminating disparities is likely to stall, with substantial consequences for both the public health and the economy of the United States.
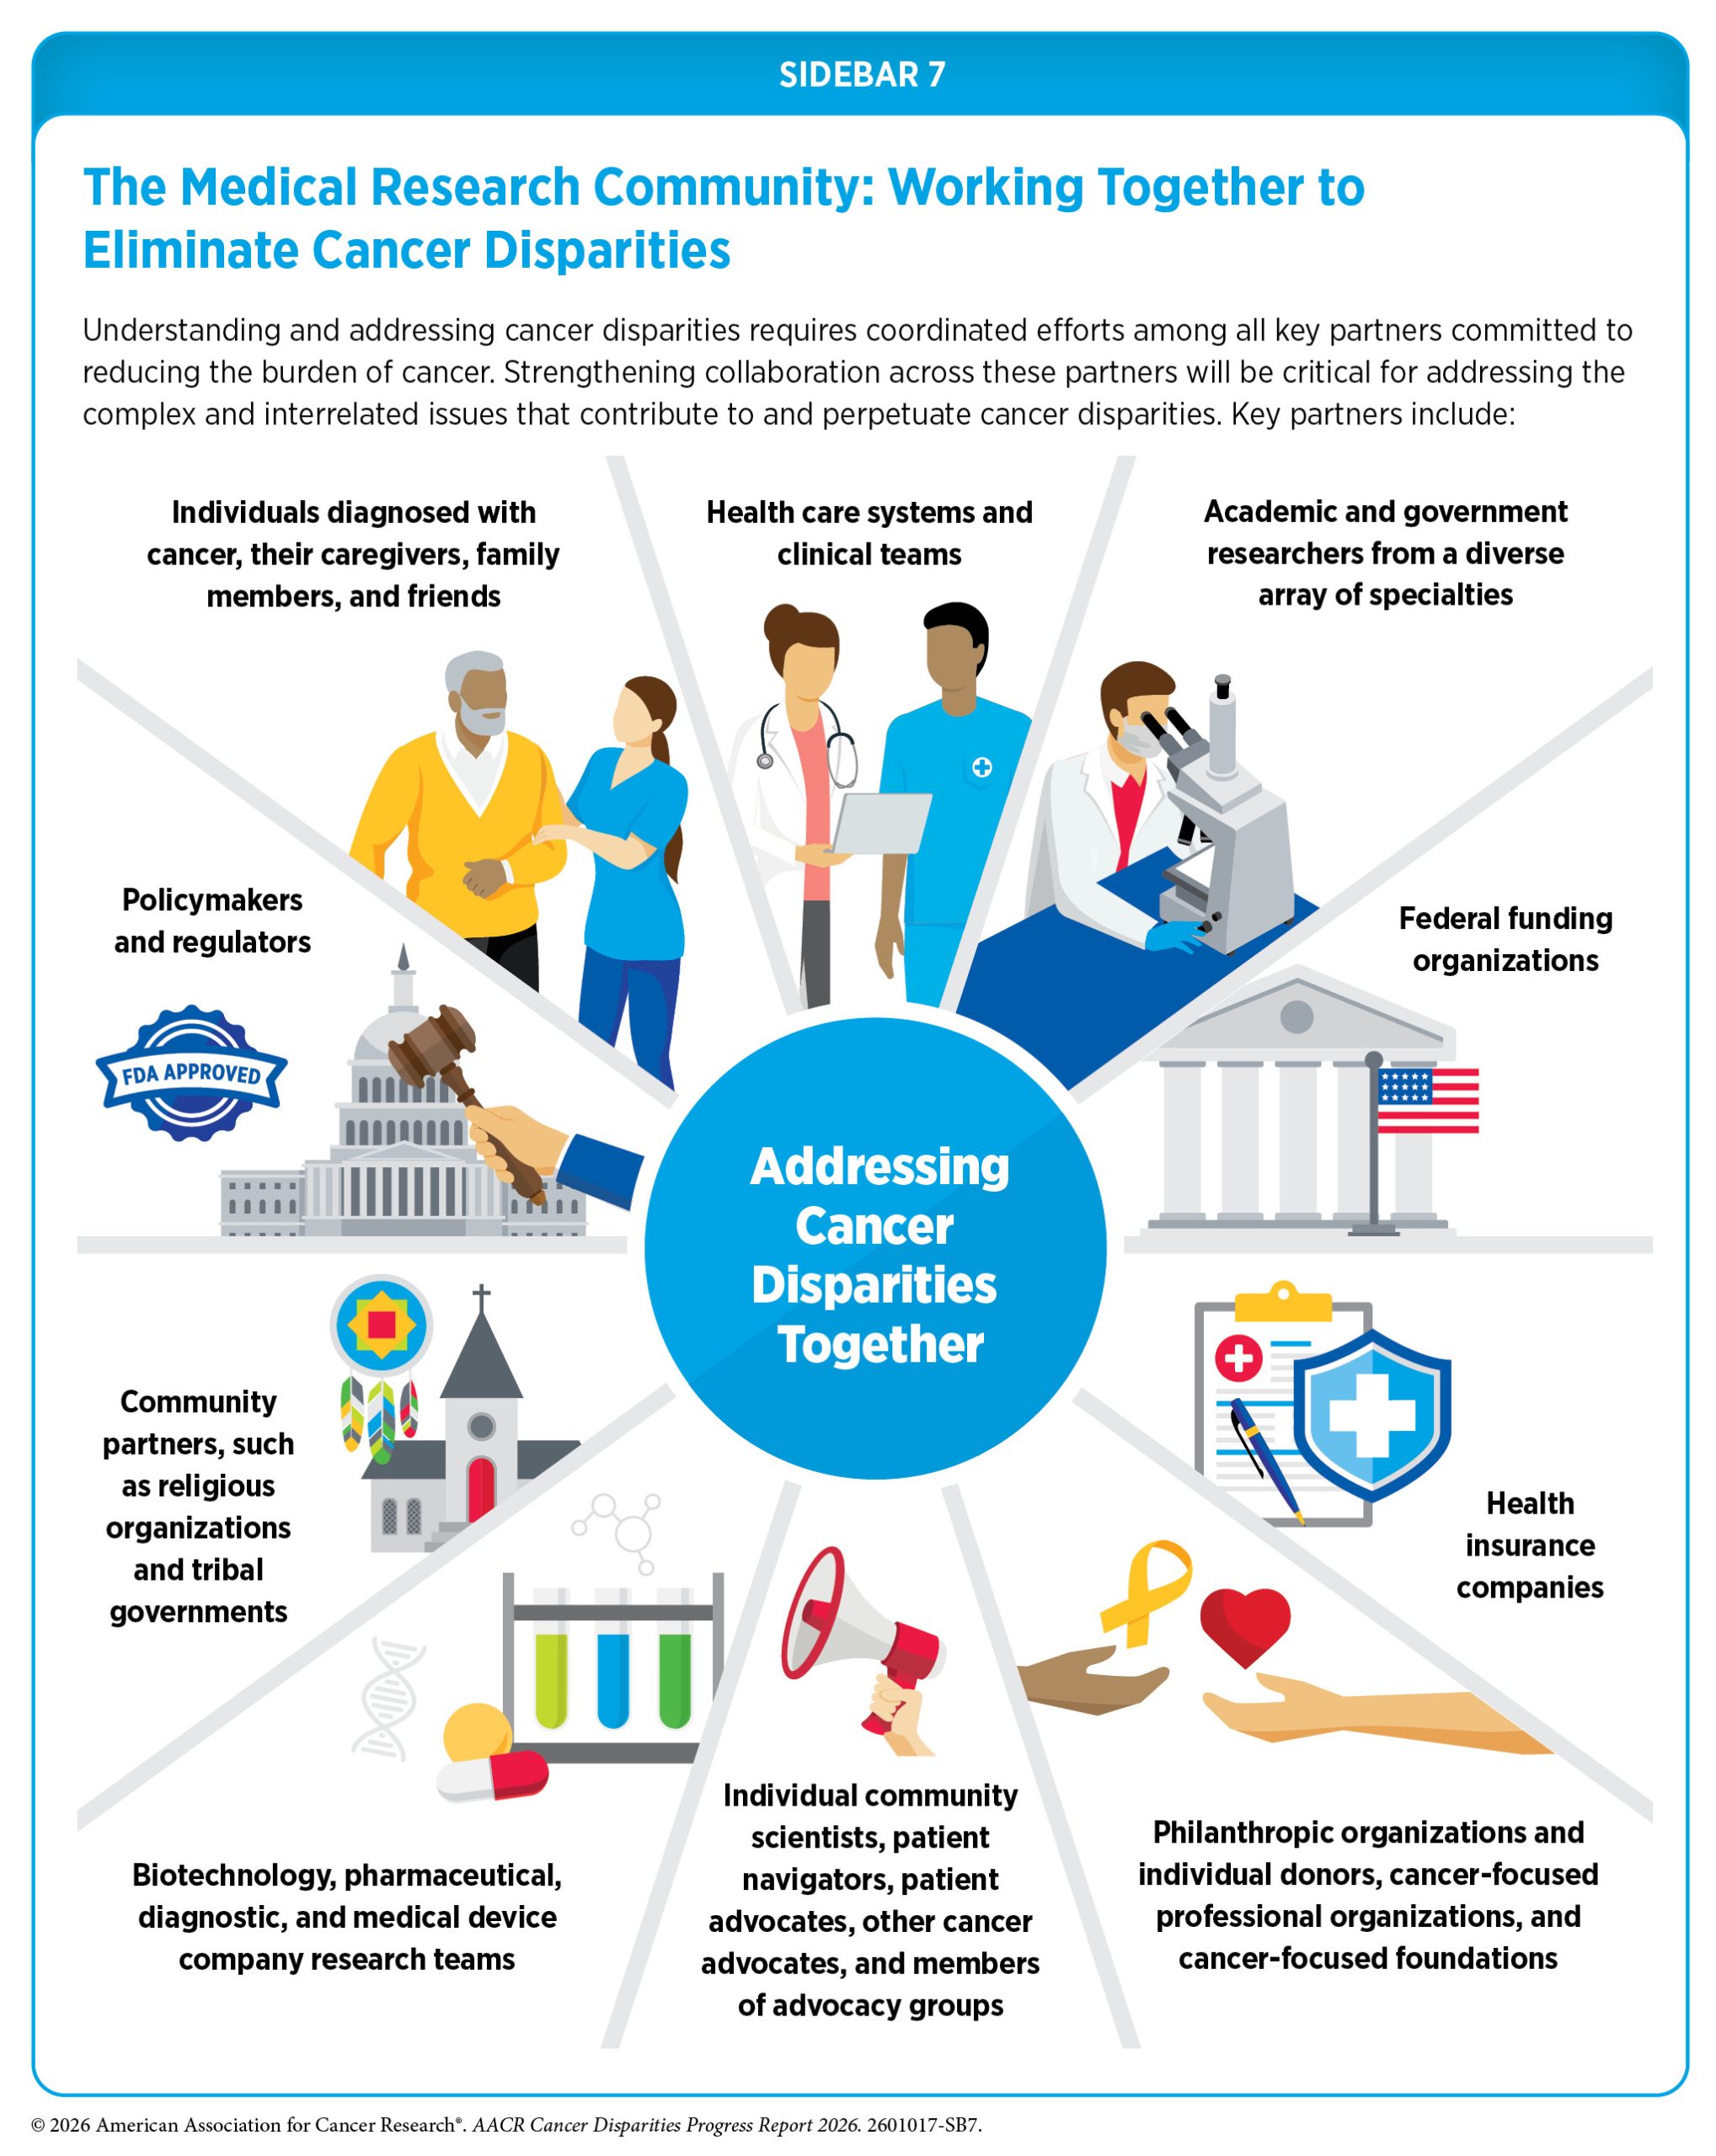
In recent years, there has been increased recognition within the cancer community and the broader public health field that addressing cancer disparities is essential for improving cancer outcomes for all patients, and key partners across the continuum of cancer care are working together to understand and address these disparities (see Sidebar 7). The National Institute on Minority Health and Health Disparities (NIMHD), along with NCI and its Center to Reduce Cancer Health Disparities (CRCHD), continues to play a central role in supporting research and programs aimed at understanding and reducing the burden of cancer disparities (see Disparities in the Cancer Training Pathway and Cancer Research and Care Workforce).
However, recent shifts in the research and federal policy landscape are challenging ongoing efforts to address and eliminate cancer disparities. Emerging evidence suggests that these policy changes are already affecting the cancer disparities workforce by disrupting research funding, training opportunities, and ongoing projects critical to advancing cancer health equity, as is evident from a recent AACR survey.
AACR Survey of Cancer Disparities Researchers: View the ResultsComplex and multidimensional factors continue to drive cancer disparities across multiple segments of the US population (see Understanding and Addressing Drivers of Cancer Disparities). Consequently, sustained, coordinated, comprehensive, and adequately resourced efforts are required to eliminate them. Continued progress will depend on stable and sufficient federal investment in research, public health infrastructure, and evidence-based programs aimed at understanding and reducing disparities across the cancer continuum (see AACR Call to Action). Such investments will be critical to lowering the cancer burden and improving outcomes for all populations.
Next Section: Understanding And Addressing Drivers of Cancer Disparities Previous Section: A Snapshot of US Cancer Disparities and Progress Toward Equity
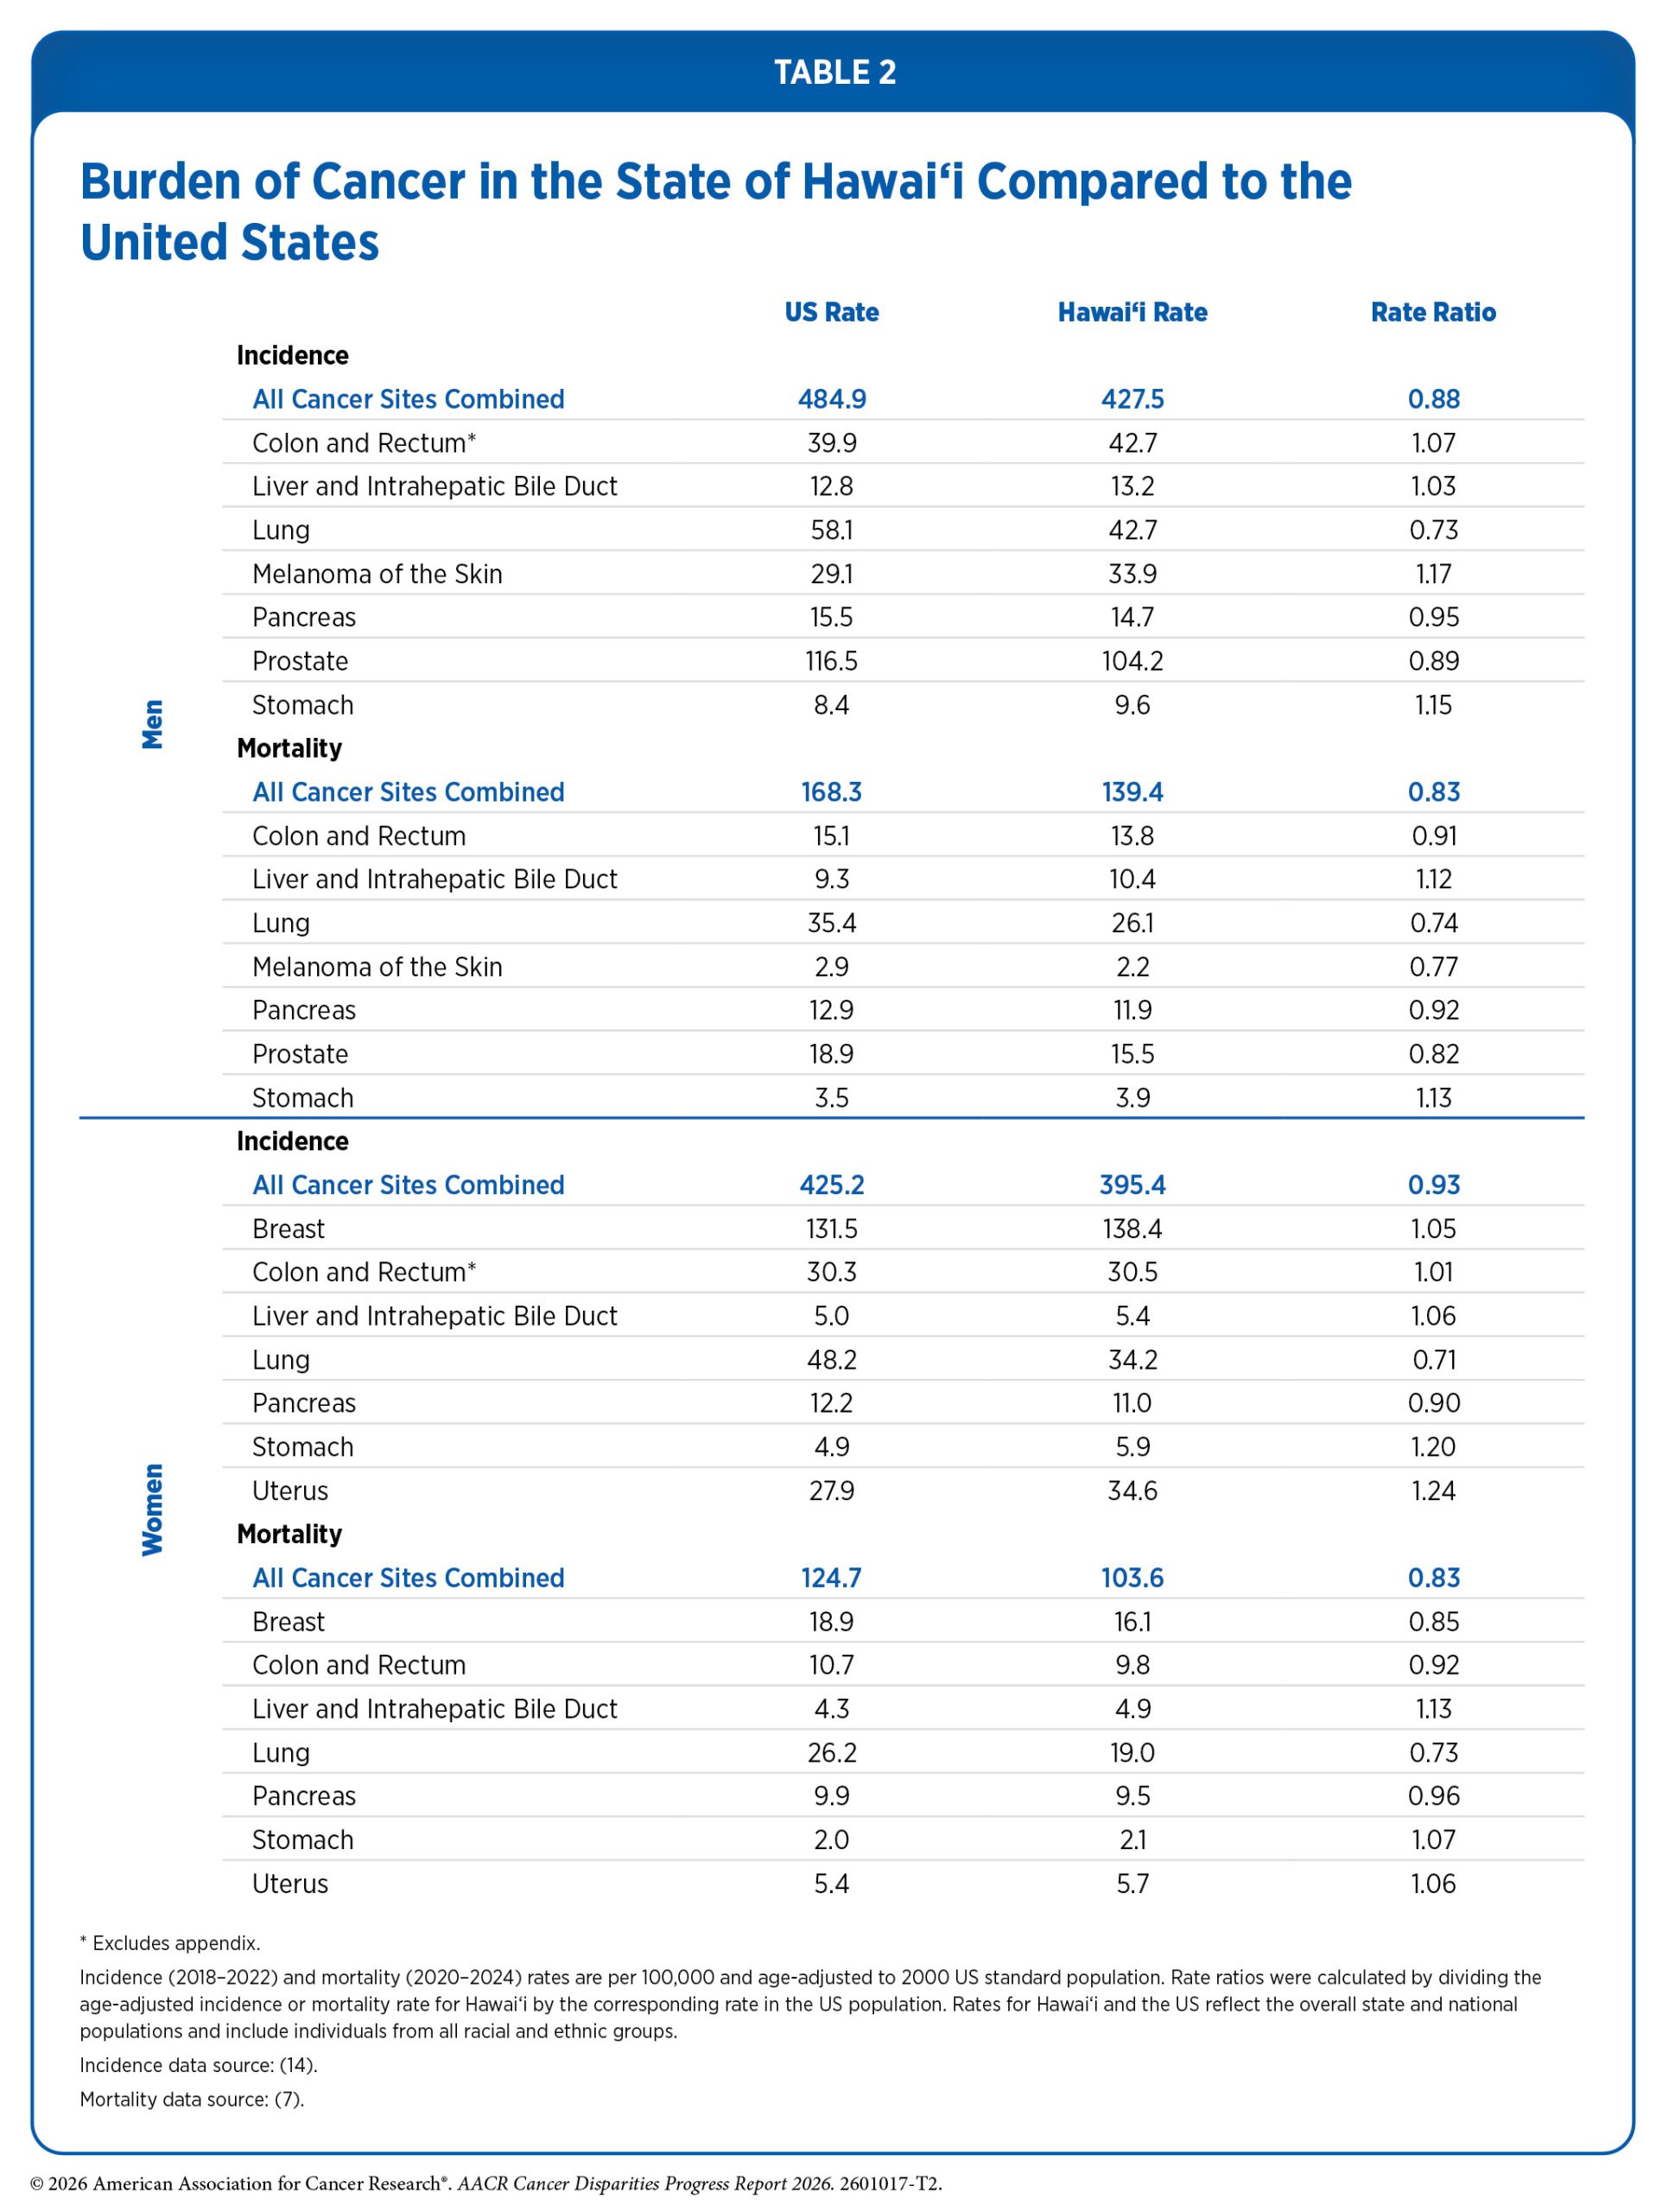