- Cancer Disparities Experienced by US Racial and Ethnic MInority Populations
- American Indian or Alaska Native (AI/AN) Population
- Asian Population
- Black or African American Population
- Hispanic or Latino/a Population
- Native Hawaiian or Other Pacific Islander (NHOPI) Population
- Cancer Disparities Experienced by Other Medically Underserved Populations
- Populations Residing in Rural Areas
- Populations Identifying as Sexual and Gender Minority
- Populations Living Under Poverty
- Achieving Health Equity: A Vital Investment for the US Public Health and Economy
The State of US Cancer Disparities in 2024
In this section, you will learn:
- Cancer disparities are adverse differences in the cancer burden that are experienced by, but not limited to, racially and ethnically minoritized groups, rural residents, citizens of sovereign Native Nations, those identifying as sexual and gender minorities, and those living under persistent poverty.
- In recent decades, disparities in the burden of certain cancer types have declined among racial and ethnic minority populations.
- Compared to the White population, Black people were 24 percent more likely to die from lung cancer in 1990, a disparity that has been drastically reduced in 2020. Similarly, gaps in cervical cancer deaths for Hispanic populations and in stomach cancer deaths for Asian and Pacific Islander populations have narrowed significantly over the past two decades.
- Despite some progress, substantial differences in cancer burden remain. Constituents across the cancer care continuum are working together to understand and reduce cancer disparities.
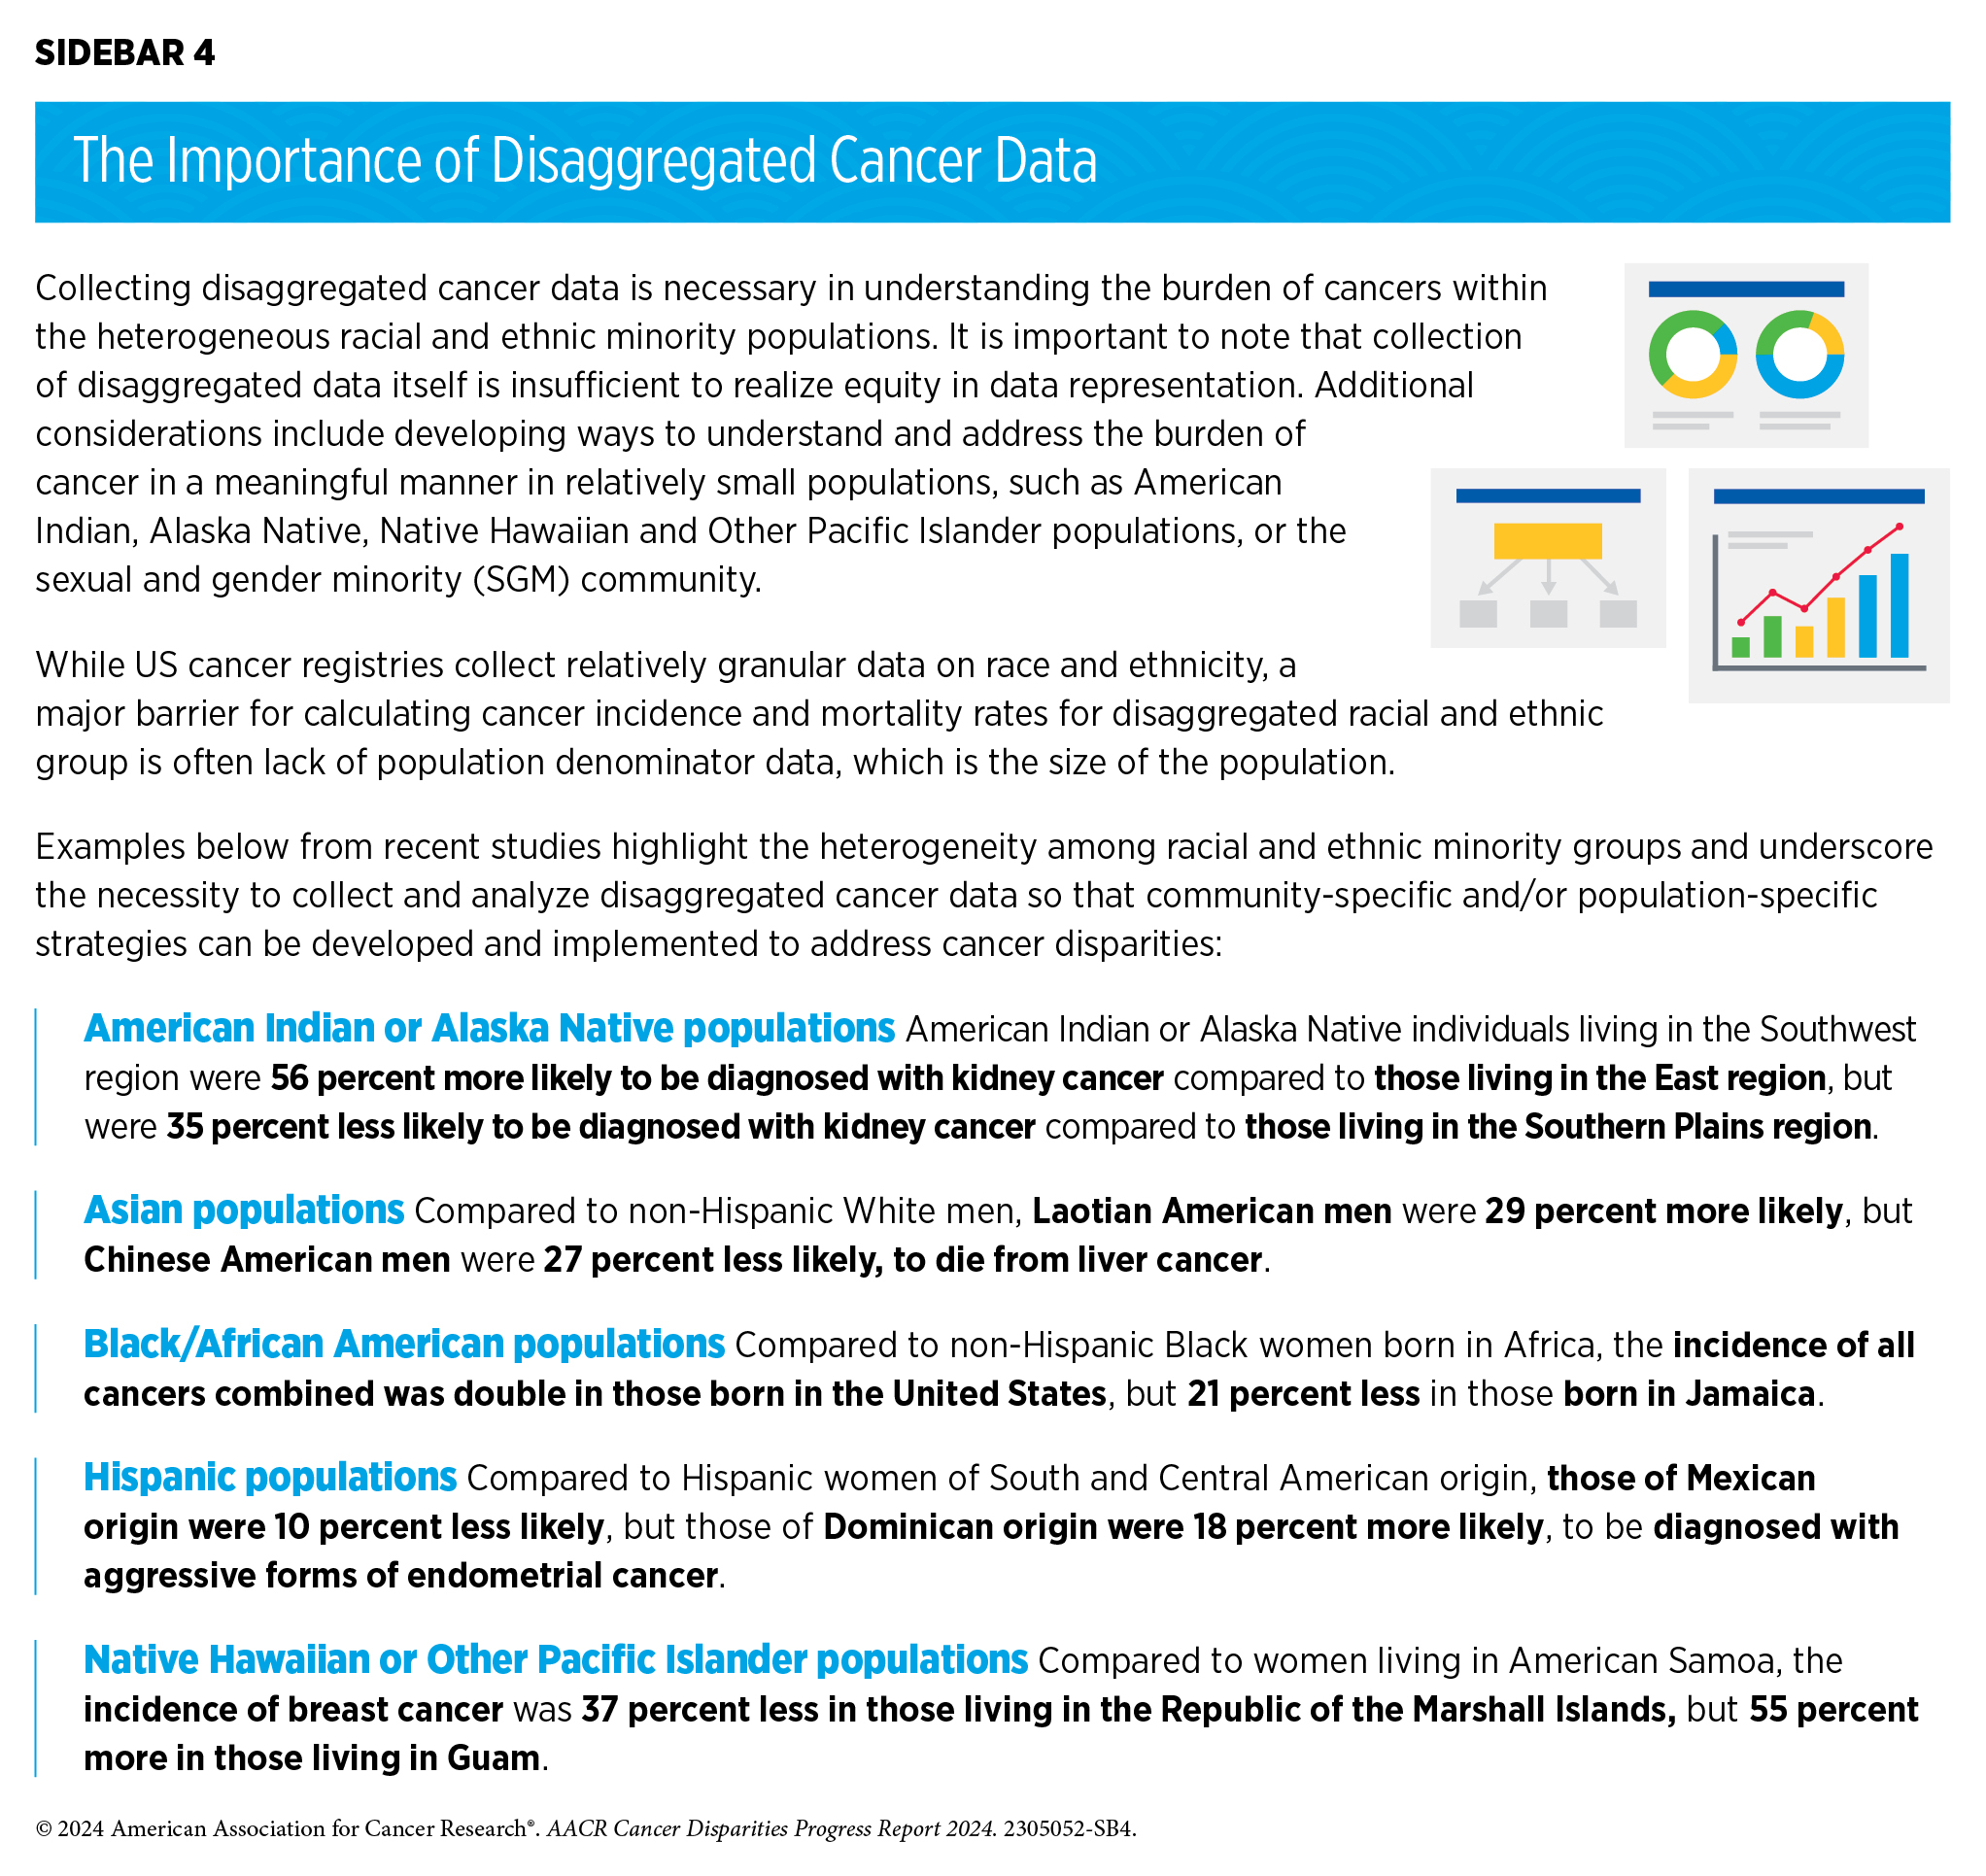
- Research is revealing that the aggregated cancer data that are currently available in most cancer registries and databases may mask underlying cancer disparities within subgroups of racial or ethnic populations, necessitating the collection of disaggregated cancer data.
- The cost of health disparities, including cancer disparities, to the US economy in 2018 alone was $451 billion, the majority of which was disproportionately borne by racial and ethnic minority populations.
Contents
Major advances in cancer prevention, early detection, treatment and cancer survivorship care have accelerated the pace of progress against cancer in recent decades. The overall cancer death rate in the United States (US) declined by one-third from 1991 to 2021. During the same period, the number of individuals living with a history of cancer diagnosis more than doubled from 7.2 million in 1992 to 18.1 million in 2022 (1)American Association for Cancer Research. AACR Cancer Progress Report 2023. Accessed: Feb 29, 2024.. Despite the overall progress against cancer, substantial challenges remain.
Cancer disparities are among the most significant public health challenges in the United States. Due to structural, social, environmental, and economic disadvantages, certain US population groups carry a disproportionately high burden of cancer. According to the National Cancer Institute (NCI), cancer disparities are differences in cancer-related measures that include number of new cases, number of deaths, cancer-related health complications, survivorship and quality of life after treatment, screening rates, and stage at diagnosis. Cancer disparities persist, and may even worsen, if improvements are not observed equally in all population groups. Because research and medical advances thus far have not been applied equitably across all segments of the population, the burden of cancer continues to disproportionately impact racially and ethnically minoritized groups and medically underserved populations, including those identifying as sexual and gender minorities (SGM) and those living in rural areas and/or under persistent poverty.
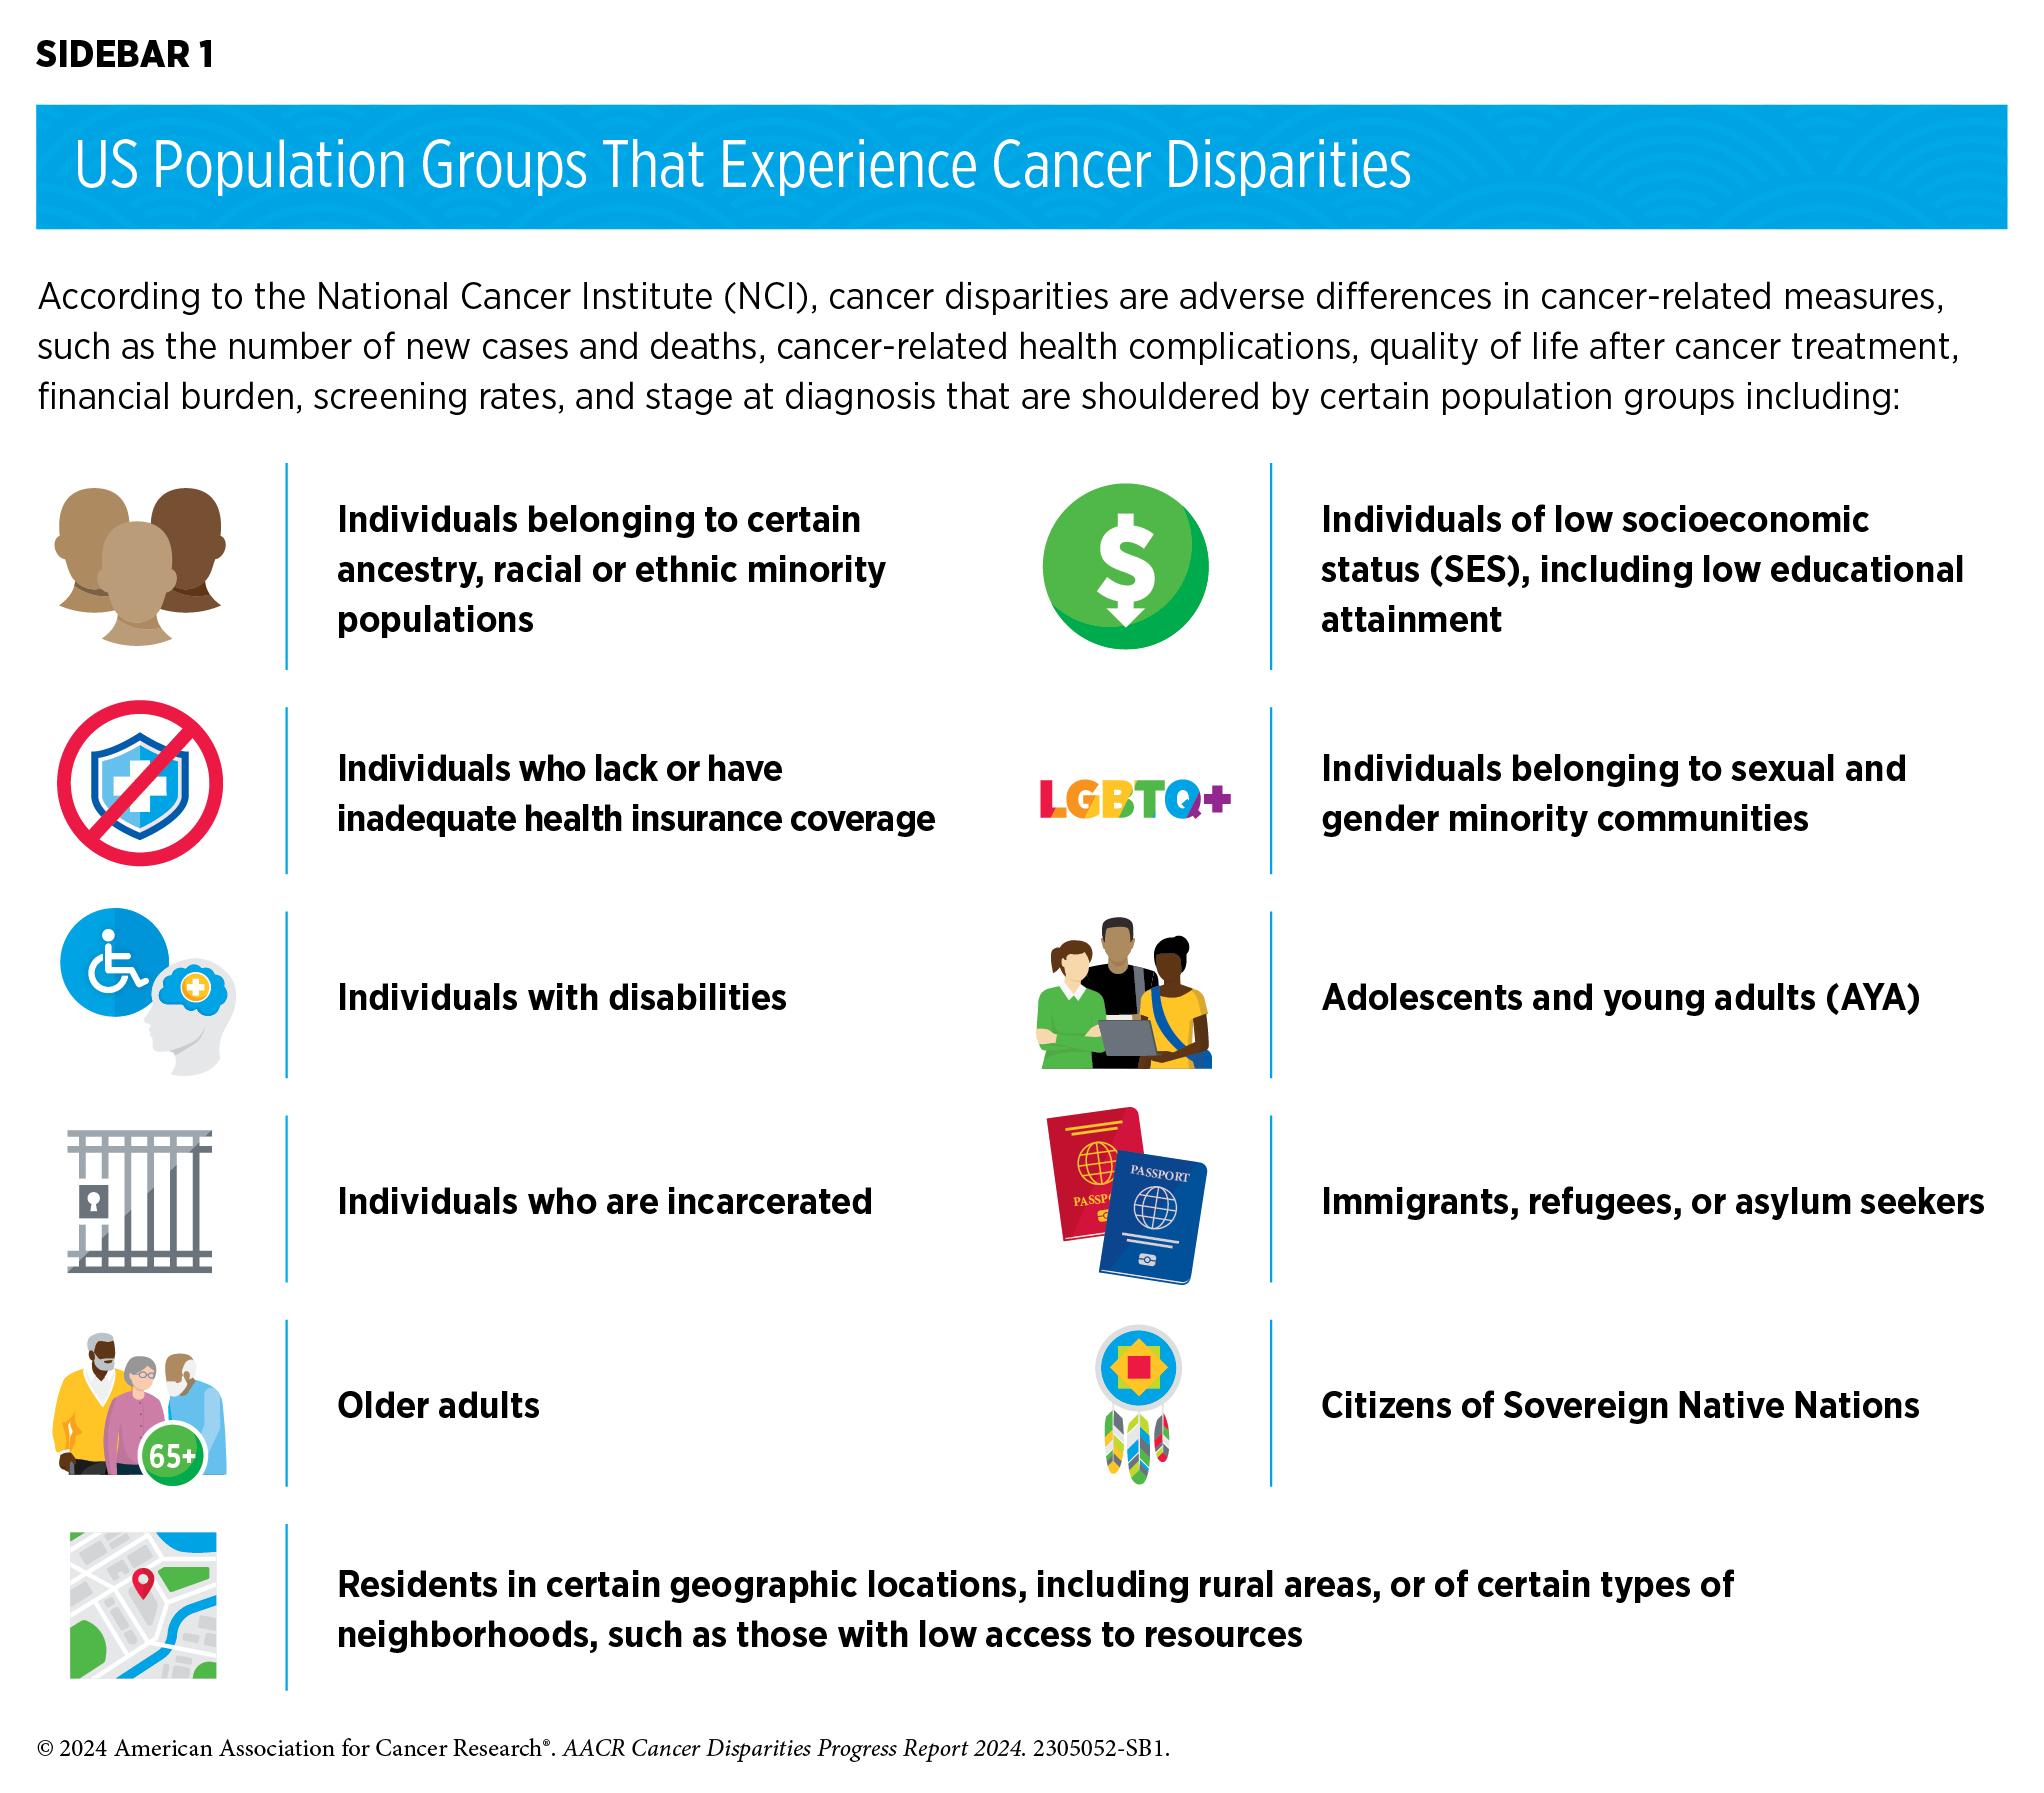
In the United States, a long history of racism, segregation, and discrimination against marginalized population groups has resulted in structural inequities and societal injustices that cause and perpetuate many of the cancer disparities discussed in this report. Population groups who experience cancer disparities may be characterized by race, ethnicity, disability, gender and sexual identity, geographic residential location, income, education, and other characteristics (see Sidebar 1), and disparities may be further compounded among those at the intersections of multiple minoritized identities.
Cancer Disparities Experienced by US Racial and Ethnic Minority Populations
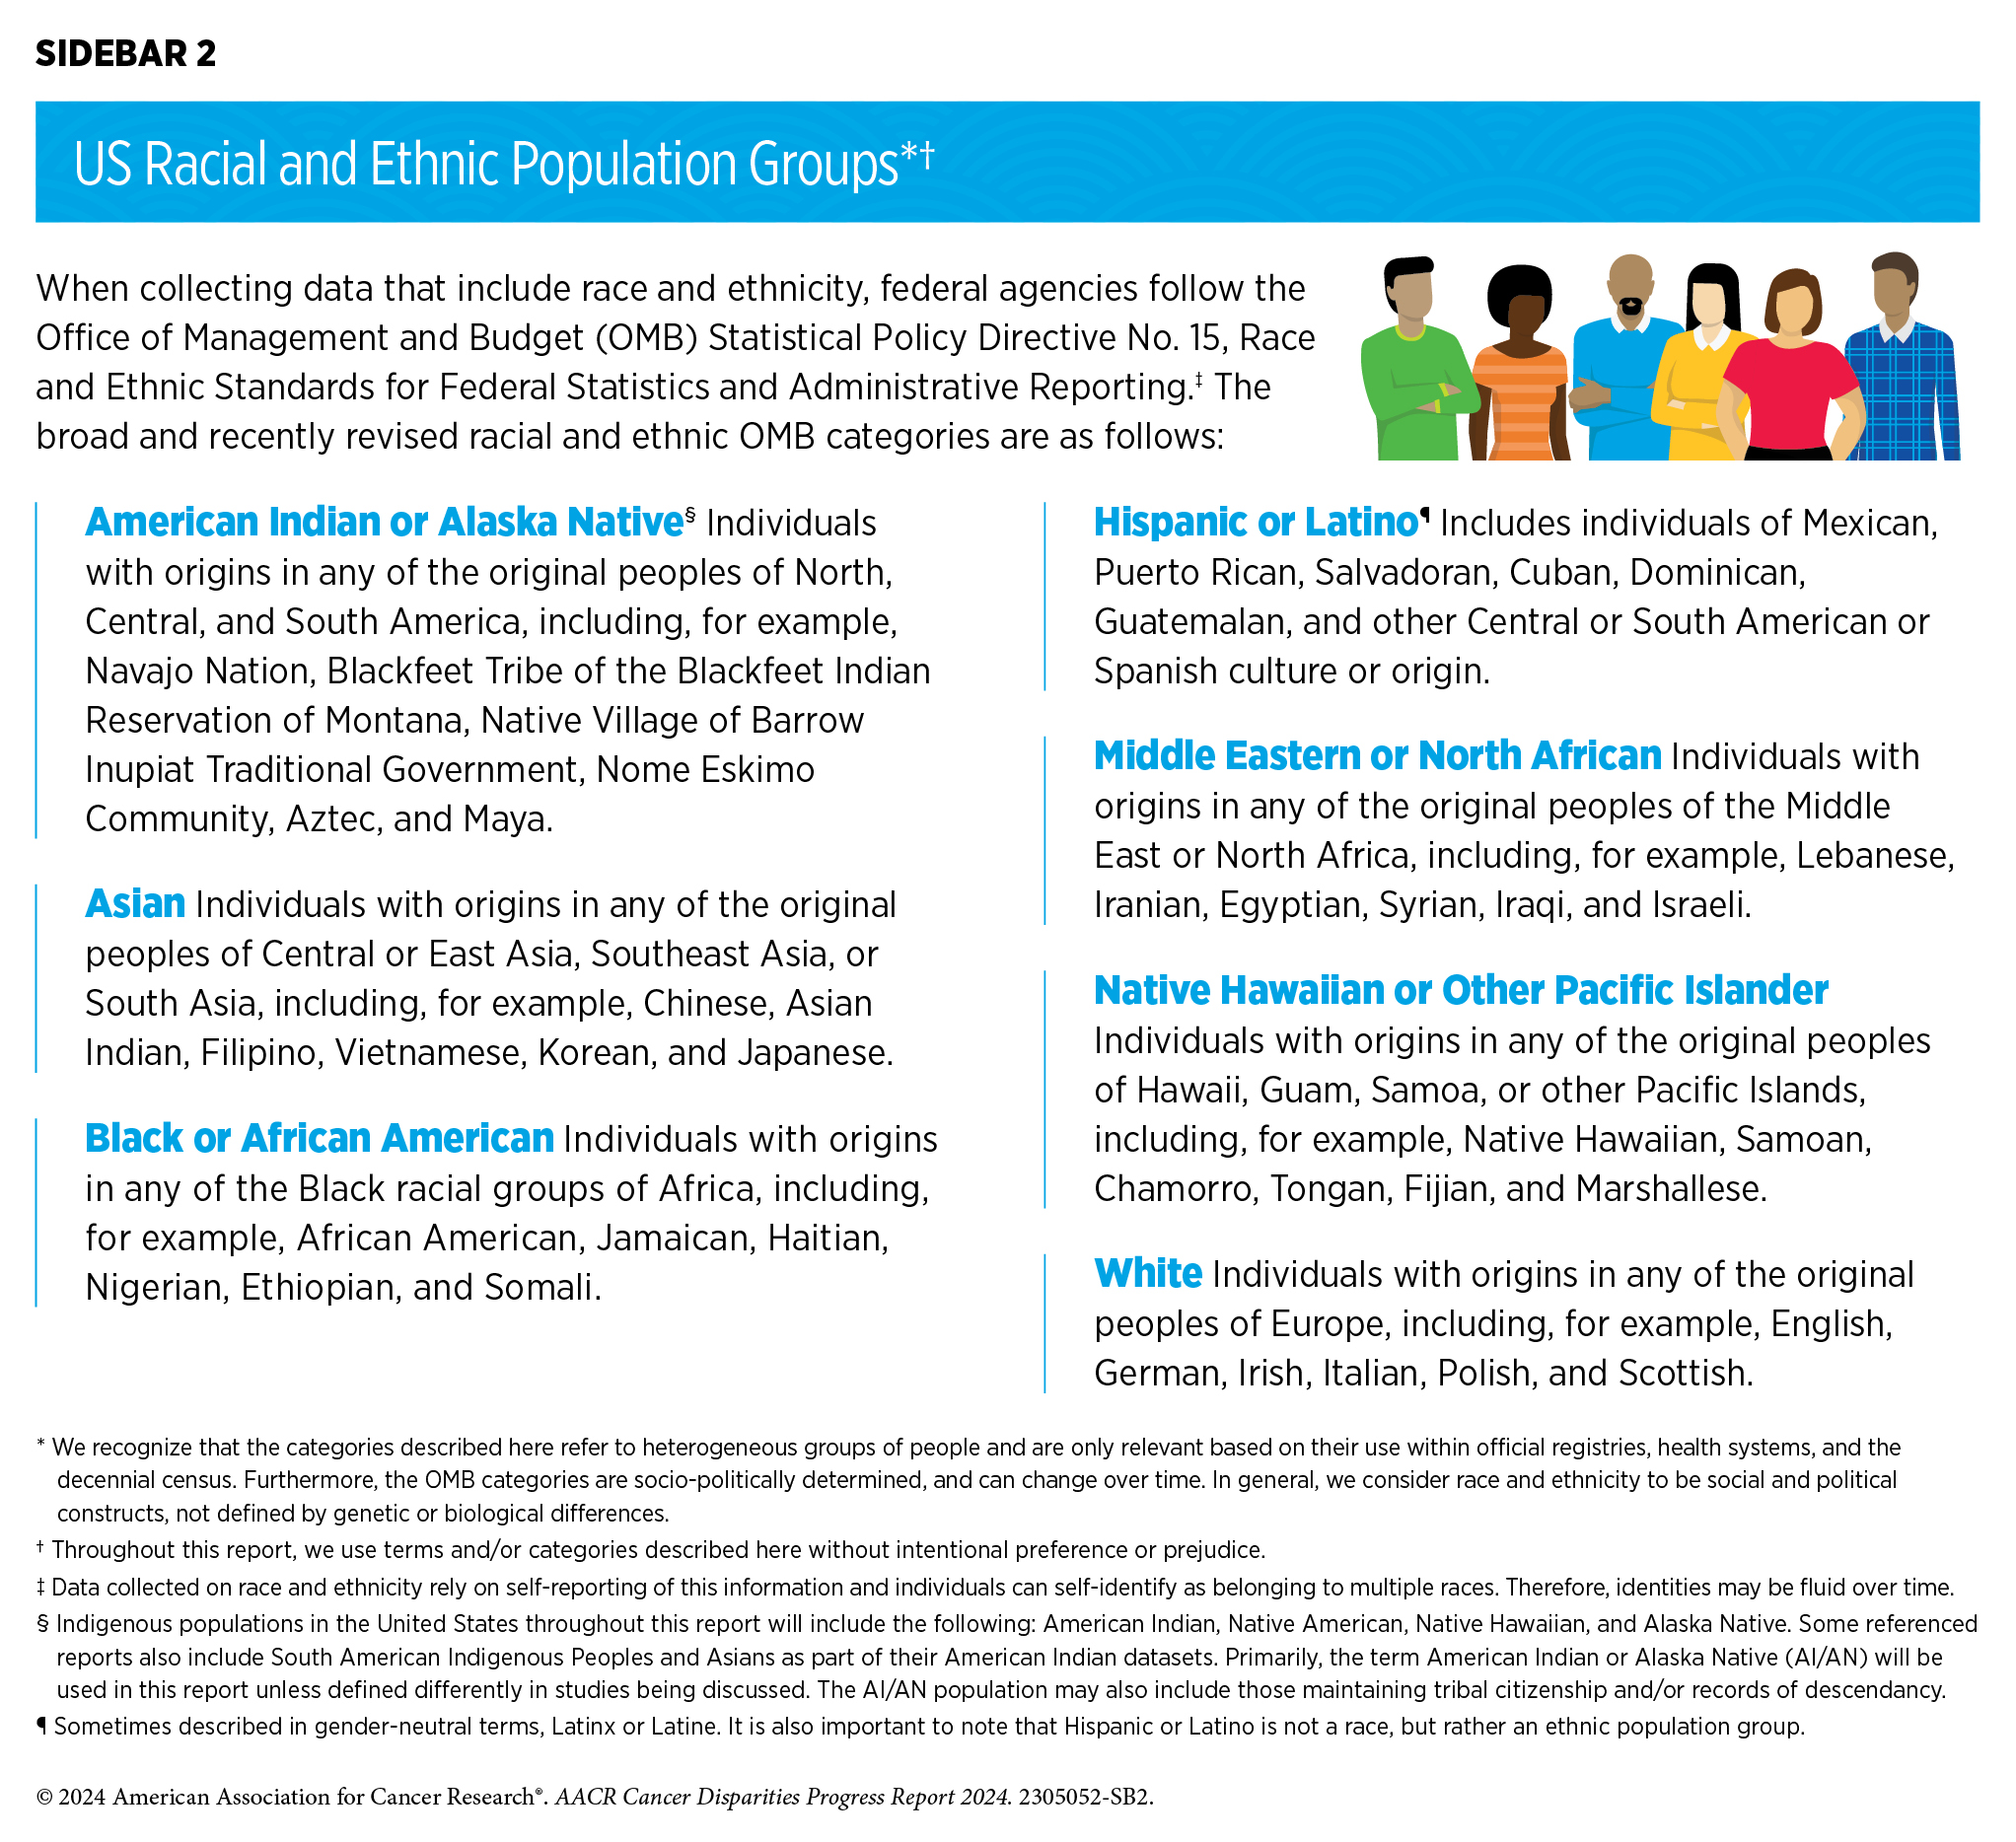
According to the 2020 Census, racial and ethnic minority groups constitute 40 percent of the US population (see Sidebar 2). The rapidly increasing diversity of the US population is of particular importance since the 2020 Census projects that racial and ethnic minority populations will become the majority population by 2045. As highlighted throughout this report, all racial and ethnic minority populations experience varying degrees of cancer disparities (2)Islami F, et al. (2023) CA Cancer J Clin, 74: 136 [LINK NOT AVAILABLE]. During 2016–2020, the incidence rate for all cancers combined was higher among Black men, for colorectal and cervical cancers was higher among American Indian and Alaska Native (AI/AN) people, and for cervical cancer was higher among Hispanic women, compared to their respective non-Hispanic (NH) White counterparts. Similarly, the overall cancer mortality rate during 2016–2020 was 18 percent and 19 percent higher, respectively, among Black and AI/AN men and 16 percent and 12 percent higher, respectively, among AI/AN and Black women, compared to their NH White counterparts. During 2014–2020, patients with cancer from all racial and ethnic minority groups had a lower 5‐year relative survival compared to their NH White counterparts (2)Islami F, et al. (2023) CA Cancer J Clin, 74: 136 [LINK NOT AVAILABLE].
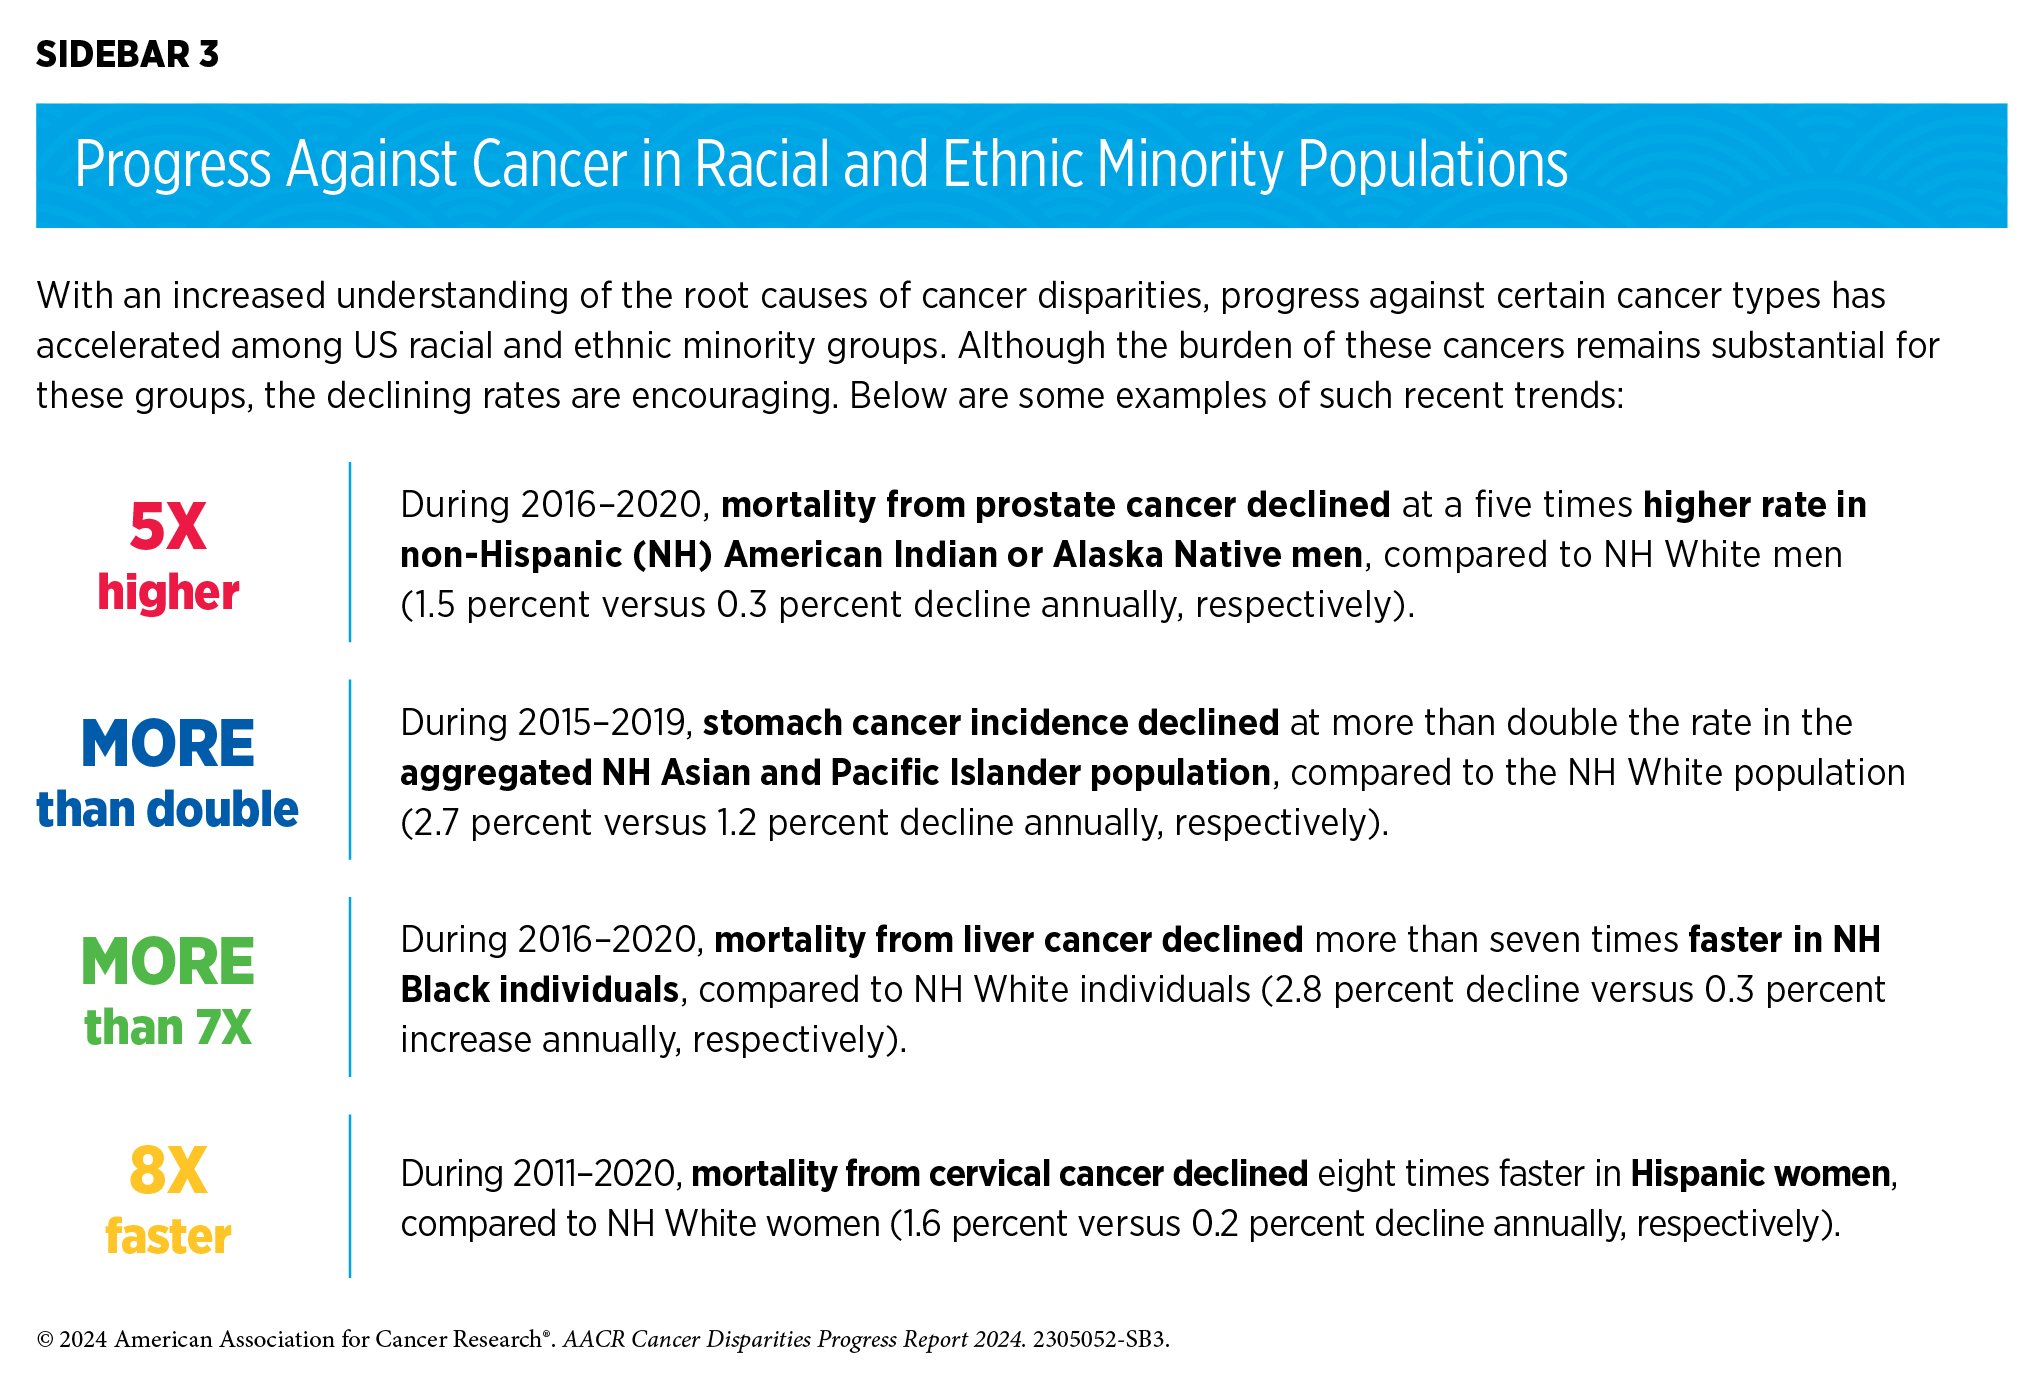
Encouragingly, years-long work among multiple constituents across the cancer continuum has begun to reduce some cancer disparities. Over the past two decades, progress against certain cancer types in racial and ethnic minority populations has accelerated compared to the NH White population (see Sidebar 3 and Figure 1).
Despite some progress, much work remains to be done to eliminate cancer disparities, not only between the White population and other racial and ethnic populations, but also between distinct subgroups within each racial and ethnic population. In this section, we provide an overview of the current state of cancer disparities experienced by racial and ethnic minority groups and other medically underserved populations in the United States.
American Indian or Alaska Native (AI/AN) Population
| At A Glance: American Indian or Alaska Native (AI/AN) Population in 2020* |
| Number and proportion of the US population†: 3.7 million people or about 1.1 percent New cancer cases‡: 9,668 Cancer deaths‡: 3,385 Most common cancers§: Female breast, prostate, and lung and bronchus cancers Most common causes of cancer deaths§: Lung and bronchus, female breast, and colorectal cancers |
*Most recent year/timeframe for which such data are available.
†Based on the Census 2020. Numbers shown are for those who identified as AI/AN alone, and not in combination with another race.
‡Data indicate reported numbers for 2020 for non-Hispanic AI/AN population (4).
§2016–2020, most recent timeframe for which such data are available.
There are 574 federally recognized AI/AN tribes or people groups in the United States, spanning diverse customs, languages, and histories. The AI/AN population has significant racial misclassification in health data (5)Espey DK, et al. (2014) Am J Public Health, 104 Suppl 3: S286. [LINK NOT AVAILABLE](6)Espey DK, et al. (2008) Cancer, 113: 1120. [LINK NOT AVAILABLE]—and an imprecise estimation of the disease burden—warranting a cautious approach when drawing conclusions about the accurate burden of cancer in the group (see Sidebar 4). AI/AN individuals with cancer are also under-documented in cancer databases, such as the National Cancer Database, a cancer registry that is widely used in research. A recent study found that the percentage of AI/AN individuals diagnosed with breast, colorectal, lung, and prostate cancer who are captured in the National Cancer Database has doubled from 20.7 percent during 2004–2006 to 41.4 percent during 2017–2019 (7)Satpathy Y, et al. (2023) JAMA Netw Open, 6: e2350237. [LINK NOT AVAILABLE]. This is encouraging because the representation of AI/AN patients in cancer databases that accurately reflects this population’s cancer burden is critical to fully understanding and addressing cancer disparities they face. Furthermore, new data analysis tools, such as Centers for Disease Control and Prevention (CDC)’s dashboard for the cancer incidence and mortality rates in the NH AI/AN populations, are expected to improve understanding of the cancer burden in these communities.
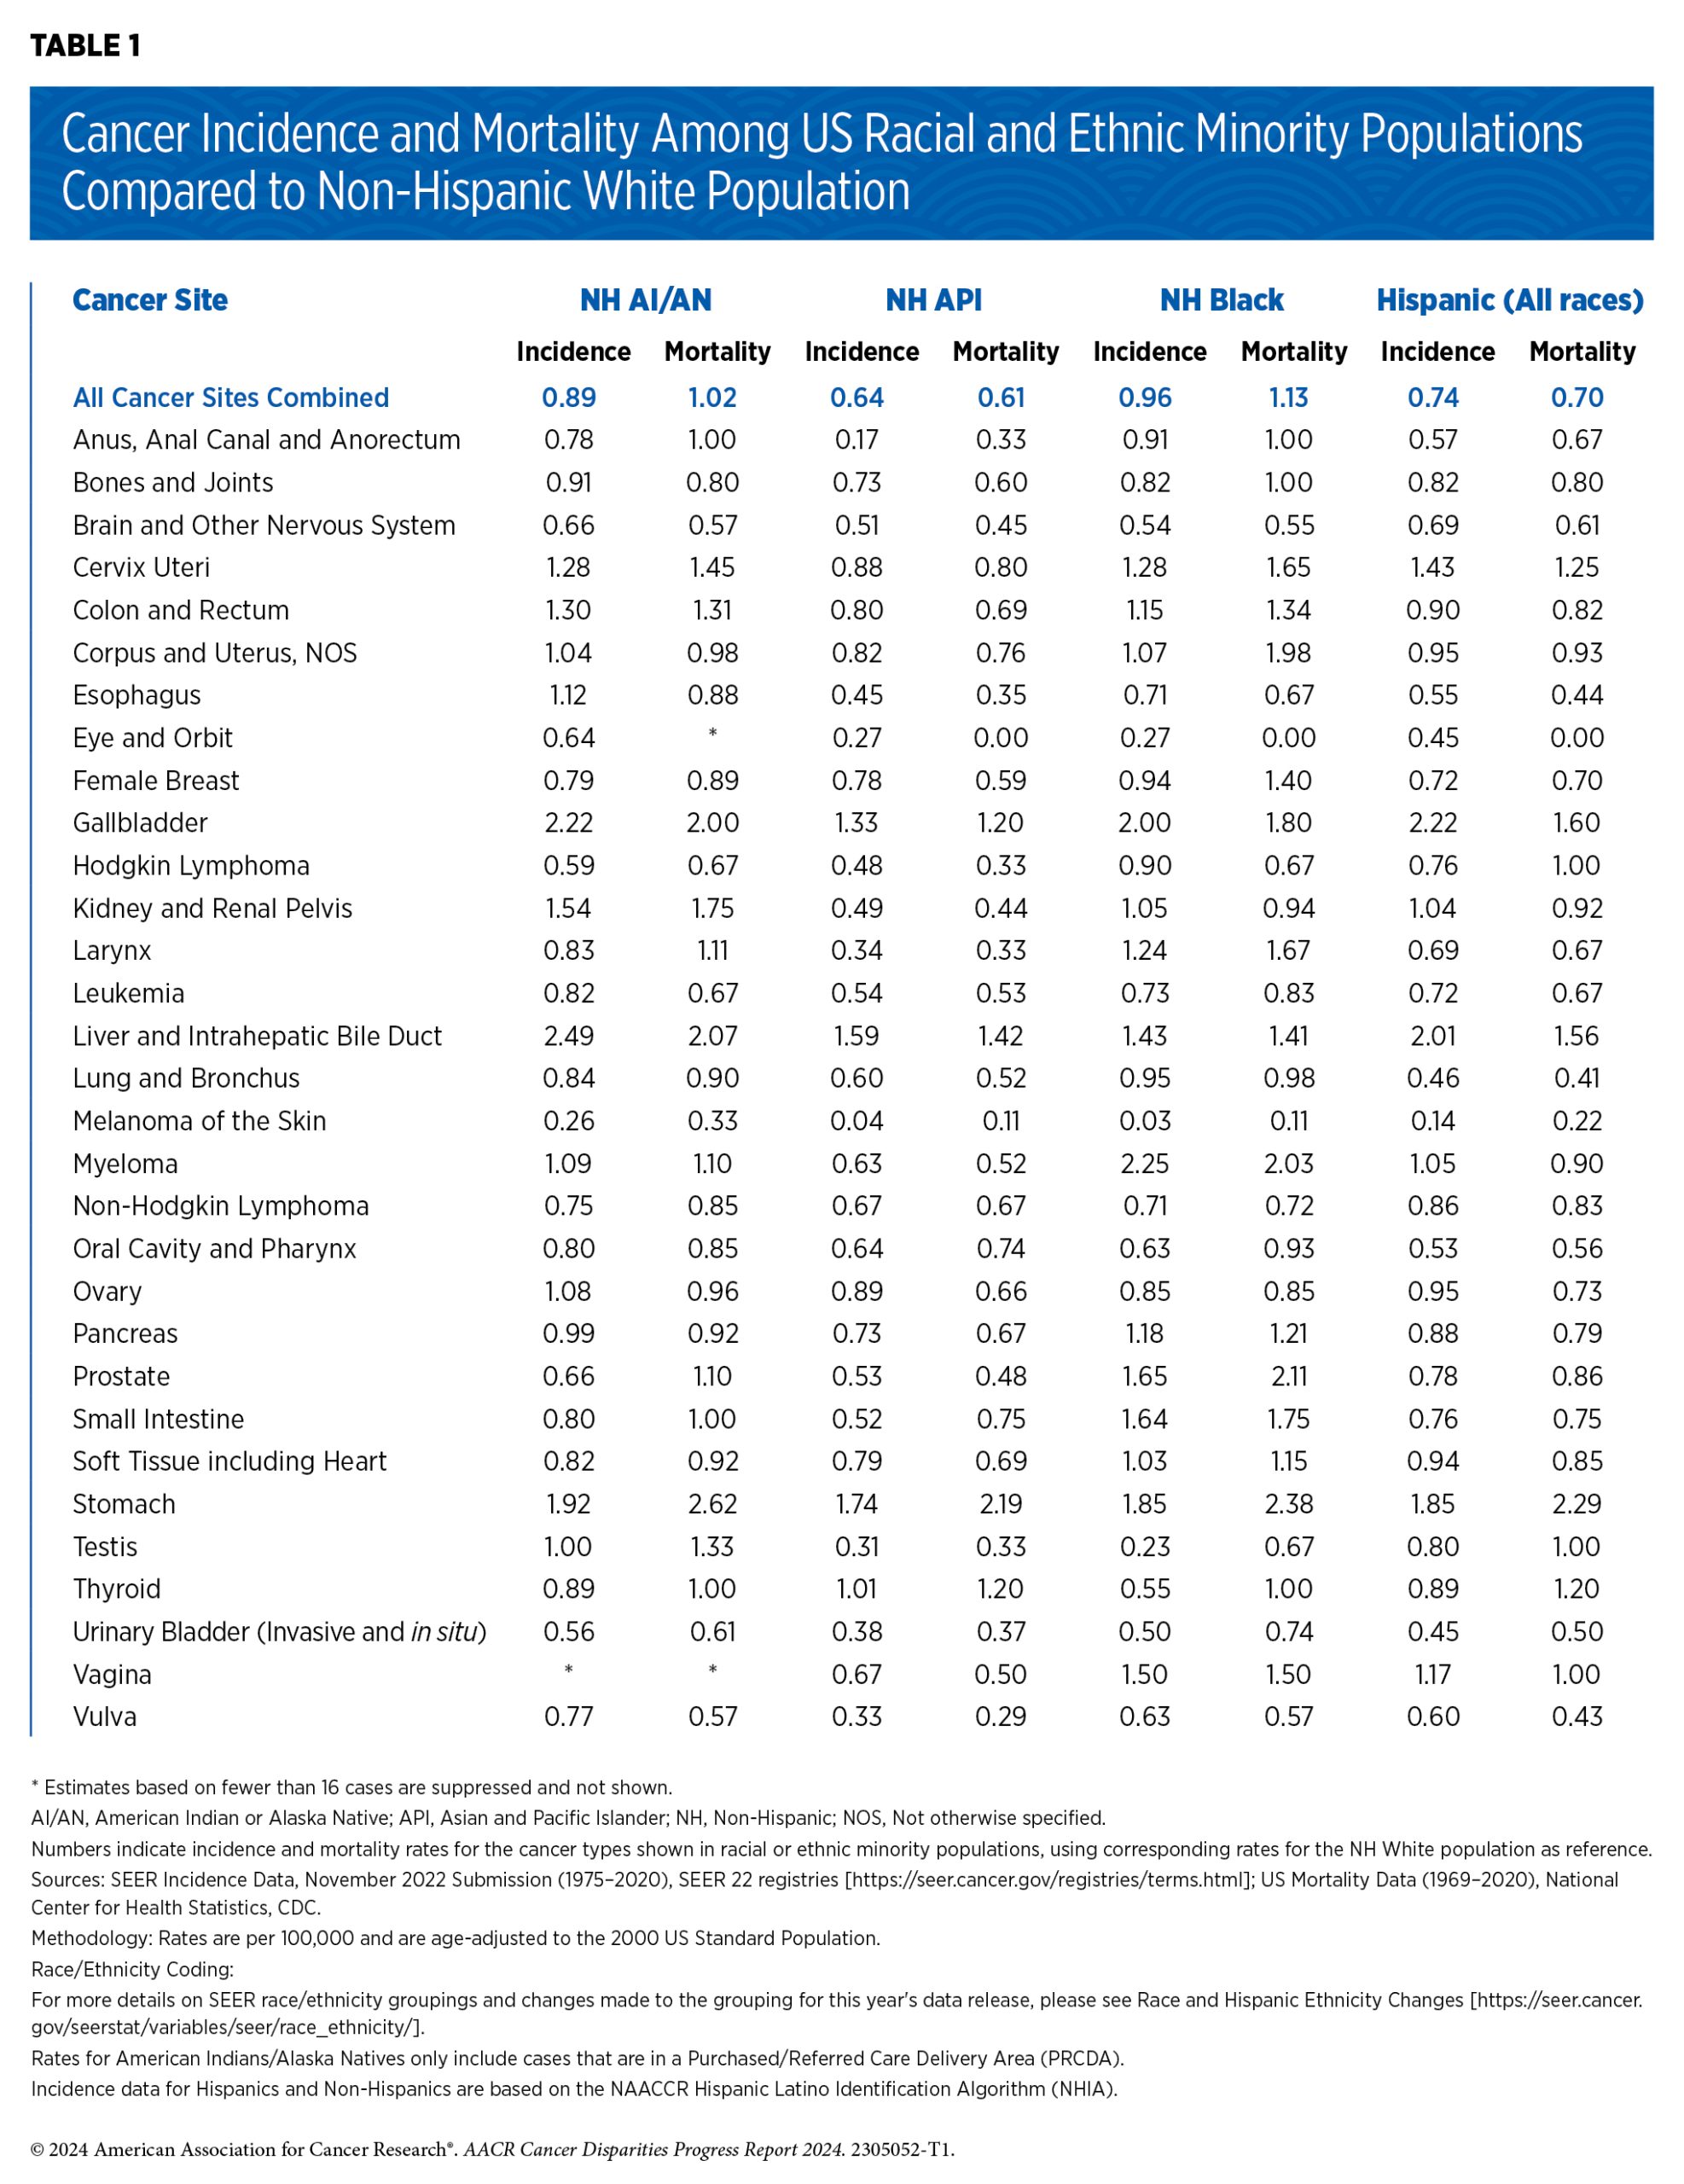
During 2016–2020, the overall incidence of all cancer types combined was about the same for the NH AI/AN and NH White populations (461.2 versus 455.1 per 100,000 cases, respectively) (see Table 1). However, during the same period, the NH AI/AN population experienced varying degrees of disparity in incidence for cancers of the colon and rectum, kidney, liver, stomach, gallbladder, and cervix uteri when compared to the NH White population. Of these, the NH AI/AN population had 2.22, 2.49, 1.92, and 1.54 times higher incidence for cancers of gallbladder, liver, stomach, and kidney, respectively (see Table 1). Furthermore, a recent study reported that AI/AN individuals residing in Alaska had the highest incidence of colorectal cancer between 2014 and 2018, compared to any other US racial population (8)Haverkamp D, et al. (2023) Int J Circumpolar Health, 82: 2184749. [LINK NOT AVAILABLE]. The colorectal cancer incidence among AI/AN people in Alaska was also the highest in the world in 2018. (8)Haverkamp D, et al. (2023) Int J Circumpolar Health, 82: 2184749. [LINK NOT AVAILABLE]
During 2016 through 2020, the overall cancer death rate in the NH AI/AN population was about the same as in the NH White population (see Table 1). However, deaths from cancers of the stomach, liver, and gallbladder were more than double in the NH AI/AN population compared to the NH White population. The AI/AN population also had 75 percent and 45 percent higher deaths rates from cancers of the kidney and cervix uteri, respectively (see Table 1). Furthermore, AI/AN population is experiencing an increase in the incidence of early-onset cancers, i.e., incidence of cancer in adults between the ages of 18 and 49 years. For example, during 2009-2018, the incidence of early-onset colorectal cancer (EO-CRC) in AI/AN individuals aged 20 to 49 rose by 3.4 percent annually, while it increased by 1.7 percent annually in NH White individuals. Similarly, deaths from EO-CRC in the same age group during 2010–2019 increased by 3.0 percent annually in AI/AN individuals, compared to a 1.8 percent annual increase in NH White individuals (14)Kratzer TB, et al. (2023) CA Cancer J Clin, 73: 120. [LINK NOT AVAILABLE].
The Indian Health Service (IHS), within the Department of Health and Human Services (HHS), provides health services to the AI/AN populations in federally recognized tribes through facilities that are managed directly by IHS, by tribes or tribal organizations. As of 2021, there are 687 IHS and tribally owned or operated facilities located on or near reservations (15)KFF. Health Coverage Among American Indian and Alaska Native and Native Hawaiian and Other Pacific Islander People. Accessed: March 17, 2024. . If these facilities cannot provide needed health services, the IHS and tribes may contract private providers through the IHS Purchased/Referred Care program. Approximately two-thirds of the NH AI/AN population lives in tribal areas or surrounding counties, called Purchased/Referred Care Delivery Area (PRCDA) counties, that are covered by the program. These counties are located in six US regions: Alaska, East, Northern Plains, Pacific Coast, Southern Plains, and Southwest.
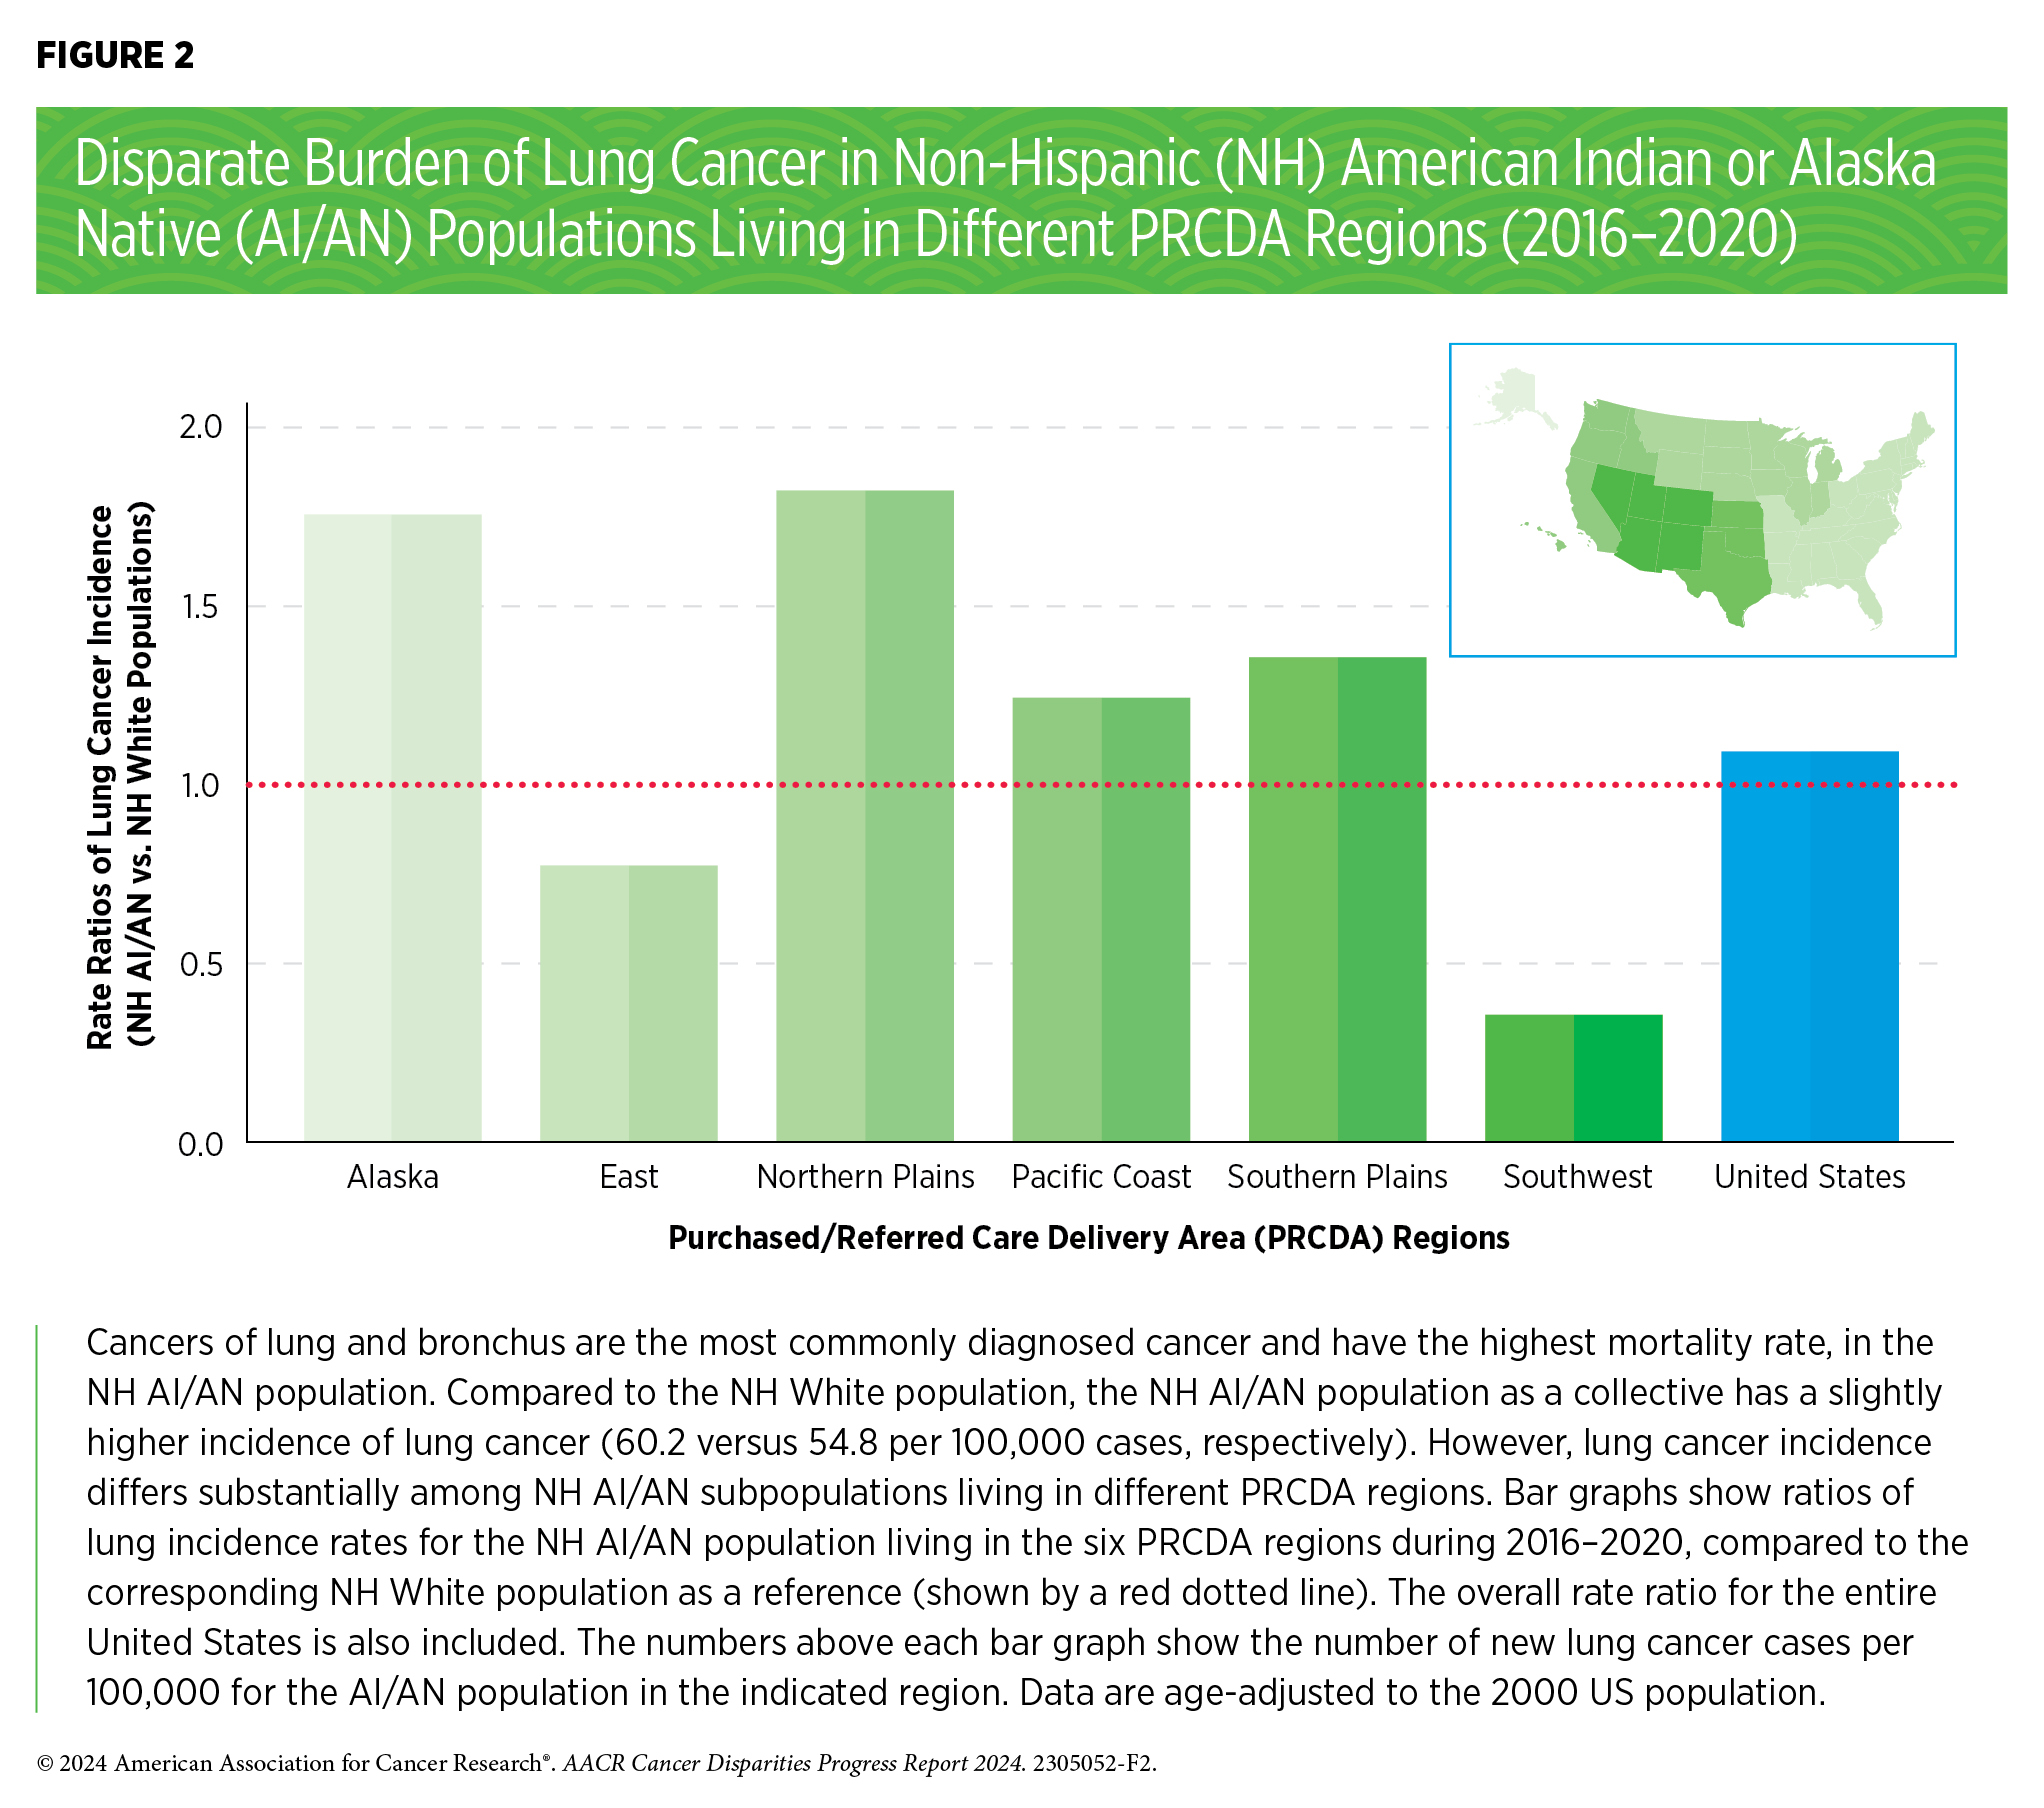
There are stark disparities in the risk of cancer incidence and outcomes within the AI/AN populations when cancer data are disaggregated by the PRCDA regions (see Figure 2). As one example, the incidence of stomach cancer in the NH AI/AN population as a collective was roughly double during 2016–2020 when compared to the NH White population (see Table 1). However, when disaggregated by the PRCDA region, the incidence rate of stomach cancer was the highest among NH AI/AN individuals living in the Alaska region and the lowest among those living in the East region (4.23 versus 1.26 times higher, respectively, compared to the corresponding NH White populations) (9)Centers for Disease Control and Prevention. Cancer Statistics At a Glance: American Indian and Alaska Native. Accessed: March 17, 2024. . Similarly, NH AI/AN individuals living in Alaska, the Northern Plains, and the Southern Plains had at least double the incidence of kidney cancer compared to those living in the East region (9)Centers for Disease Control and Prevention. Cancer Statistics At a Glance: American Indian and Alaska Native. Accessed: March 17, 2024. .
Reasons for disparities in cancer burden between the AI/AN and White populations, as well as those within the AI/AN populations residing in different PRCDA regions, stem from a long history of racism, discrimination, and systemic inequities in the United States that have substantially contributed to higher rates of tobacco and alcohol use, higher exposure to environmental carcinogens, higher rates of type 2 diabetes and chronic hepatitis C virus (HCV) infection, as well as lower access to quality health care (see Disparities in the Burden of Preventable Cancer Risk Factors) (14)Kratzer TB, et al. (2023) CA Cancer J Clin, 73: 120. [LINK NOT AVAILABLE].
Asian Population
| At A Glance: Asian Population in 2020* |
| Number and proportion of the US population†: 19.9 million people or about 6 percent New cancer cases‡: 56,790 Cancer deaths‡: 19,869 Most common cancers§: Female breast, prostate, and lung and bronchus cancers Most common causes of cancer deaths§: Lung and bronchus, female breast, and colorectal cancers |
*Most recent year/timeframe for which such data are available.
†Based on the Census 2020. Numbers shown are for those who identified as Asian alone and do not include the Native Hawaiian or Pacific Islander population.
‡Data indicate reported numbers for 2020 for the aggregated non-Hispanic Asian and Pacific Islander (API) population (4).
§2016–2020, most recent timeframe for which such data are available.
The Asian population is the fastest-growing racial group in the United States (16)Pew Research Center. Asian Americans are the fastest- growing racial or ethnic group in the U.S. Accessed: March 17, 2024. . The five largest groups constituting the Asian designation are Chinese, South Asian, Filipino, Vietnamese, Korean, and Japanese. Despite the remarkable diversity of cultures, places of birth, migration histories, and other characteristics that distinguish Asian populations from the Native Hawaiian and Pacific Islander populations, health records from the two racial groups are either aggregated or disaggregated data are not reported, thus masking the underlying differences within the population subgroups (see Sidebar 4). In this report, we use the Asian and Pacific Islander (API) designation for some of the cancer incidence and mortality rates that are only available as aggregate data.
According to recent estimates, the NH API population has the lowest overall rates of cancer incidence and mortality compared to any other racial or ethnic population (2)Islami F, et al. (2023) CA Cancer J Clin, 74: 136 [LINK NOT AVAILABLE]. However, according to the Centers for Disease Control and Prevention (CDC), NH API was the only racial or ethnic population with cancer as the leading cause of death in 2021, the most recent year for which such data are available (18)Centers for Disease Control and Prevention. Underlying Cause of Death, 2018-2021, Single Race. Accessed: March 17, 2024.. The NH API population is disproportionately affected by cancers that are caused by infectious agents, such as hepatitis B virus (HBV) and Helicobacter pylori (see Disparities in the Burden of Preventable Cancer Risk Factors) (19)Lee RJ, et al. (2021) Oncologist, 26: 453. [LINK NOT AVAILABLE]. As one example, when compared to the NH White population, the NH API population has a more than 70 percent higher probability of developing stomach cancer and double the likelihood of dying from it (see Table 1); H. pylori causes up to 75 percent of all noncardia stomach cancer cases worldwide (20)Polk DB, et al. (2010) Nat Rev Cancer, 10: 403. [LINK NOT AVAILABLE]. Similarly, NH API individuals have a 42 percent and 20 percent higher chance of dying from liver or gallbladder cancers, respectively (see Table 1), both of which are caused primarily by HBV infection.
Recent studies analyzing disaggregated data have shown a unique cancer burden for subgroups within the Asian population. One study identified large disparities in the burden of human papillomavirus (HPV)–associated cancers (21)Shing JZ, et al. (2023) JNCI Cancer Spectr, 7: pkad012. [LINK NOT AVAILABLE]. During 1990–2014, the time period covered by the study, NH API women had about a 30 percent lower likelihood of developing cervical cancer when compared to NH White women. However, there were stark differences within the Asian subgroups, with Laotian women having a four times higher risk of developing cervical cancer than Asian Indian and Pakistani women (21)Shing JZ, et al. (2023) JNCI Cancer Spectr, 7: pkad012. [LINK NOT AVAILABLE]. Another study showed stark disparities in pancreatic cancer outcomes within the disaggregated API population (22)Kooragayala K, et al. (2024) Ann Surg Oncol, 31: 1298. [LINK NOT AVAILABLE]. Based on the aggregated data of patients with pancreatic cancer, during 2010–2019, survival among API patients was higher than that among White patients (11.3 months vs. 8.9 months, respectively). However, when disaggregated by subgroups, Asian Indian patients had the highest and Japanese patients with pancreatic cancer had the lowest survival (14.3 vs. 7.6 months, respectively) (22)Kooragayala K, et al. (2024) Ann Surg Oncol, 31: 1298. [LINK NOT AVAILABLE].
A concerning trend contributing to cancer disparity in the API population is the disproportionately increasing cases of lung cancer, especially in women such as Phuong Ho, MD, who have never smoked. One study evaluating 77,642 confirmed lung cancer cases between 2014 and 2018 in Florida found that the proportion of lung cancer cases among individuals with no history of smoking was four times higher in API women compared to White women, and more than twice as high in API men as in White men (23)Pinheiro PS, et al. (2022) Lung Cancer, 174: 50. [LINK NOT AVAILABLE]. Among lung cancer cases, 27.7 percent of men had no history of smoking compared to 59.9 percent of women who had never smoked. The study further showed that, among the population who never smoked, lung cancer was the second most common cause of death in API women, compared to 14th in White women (23)Pinheiro PS, et al. (2022) Lung Cancer, 174: 50. [LINK NOT AVAILABLE]. Another study also reported that the incidence of lung cancer among API women who had never smoked was higher compared to NH White women who had never smoked (17.1 versus 10.1 per 100,000 cases, respectively) (24)DeRouen MC, et al. (2022) J Natl Cancer Inst, 114: 78. [LINK NOT AVAILABLE]. Furthermore, compared to NH White women who had never smoked, lung cancer incidence among women belonging to every API ethnic subgroup, except for the Japanese American population, was higher, and ranged from 66 percent greater among Native Hawaiian women to more than 100 percent greater among Chinese American women (24)DeRouen MC, et al. (2022) J Natl Cancer Inst, 114: 78. [LINK NOT AVAILABLE].
Studies have identified genetic and epigenetic alterations, as well as exposure to other risk factors, including occupational and environmental carcinogens, that are associated with an increased risk of developing lung cancer in individuals with no history of smoking. However, beyond the few established risk factors including exposure to secondhand and thirdhand smoke, radon, air pollution, and cooking oil fumes, additional risk factors that explain the higher lung cancer risks in API women who have never smoked have not been identified (25)Daylan AEC, et al. (2023) Lung, 201: 521. [LINK NOT AVAILABLE]. The Female Asian Never Smokers or FANS study aims to understand possible causes of lung cancer in this population, including secondhand smoke, genetics, environmental factors (e.g., air pollution and radon), and cultural factors (26)University of California San Francisco. FANS Study. Accessed: March 17, 2024. .
Black or African American Population
| At A Glance: Black or African American Population in 2020* |
| Number and proportion of the US population†: Estimated 41.1 million people or 12.4 percent New cancer cases‡: 174,757 Cancer deaths‡: 70,963 Most common cancers§: Prostate, female breast, and lung and bronchus cancers Most common causes of cancer deaths§: Prostate, lung and bronchus, female breast cancers |
*Most recent year/timeframe for which such data are available.
†Based on the Census 2020. Numbers shown are for those who identified as Black
alone, and not in combination with another race.
‡Data indicate reported numbers for 2020 for non-Hispanic Black population (4).
§2016–2020, most recent timeframe for which such data are available.
Black or African American people constitute the third largest racial/ethnic population group in the United States. The US Black population is heterogeneous and includes US-born Black people, as well as those who have immigrated to the United States and trace their ancestry to any of the Black racial groups of Africa and the African diaspora. In 2021, about 10 percent of the US Black population was foreign-born (27)Pew Research Center. Facts About the U.S. Black Population. Accessed: March 17, 2024. . The burden of cancer varies substantially within the population subgroups (see Sidebar 4).
In recent decades, the disparity in age-adjusted overall cancer deaths between the Black and White populations has declined significantly, narrowing from 32 percent in 1991 to 11 percent in 2020, the most recent year for which such data are available (3)NCI Surveillance, Epidemiology, and End Results Program. NCI SEER*Explorer. Accessed: March 17, 2024. . During 2016 through 2020, cancer mortality rates declined faster in Black men compared to White men (2.7 percent versus 2.1 percent decline per year, respectively), while cancer deaths declined at about the same rate in Black and White women (2.2 percent versus 1.9 percent decline per year, respectively).
In addition to the narrowing gap in overall cancer death rates, disparities in the burden of certain cancer types have also decreased significantly between the NH Black and White populations. As one example, the disparity between the two populations in mortality rates of colorectal cancer, the fourth highest cause of cancer deaths in the Black population in 2020 (4)Centers for Disease Control and Prevention. Cancer Statistics At a Glance. Accessed: March 17, 2024. , has steadily narrowed from 40 percent in 2000 to 30 percent in 2020 (3)NCI Surveillance, Epidemiology, and End Results Program. NCI SEER*Explorer. Accessed: March 17, 2024. . Furthermore, according to the latest trends, colorectal cancer mortality rates from 2016 to 2020 declined faster among Black people compared to White people (2.9 percent versus 1.8 percent annual decline, respectively). Mortality rates from lung cancer have also significantly declined in the Black population. In 1990, Black people were 24 percent more likely to die from lung cancer than White people (mortality rate: 72.1 versus 58.2 per 100,000, respectively). In 2020, this disparity has been drastically reduced (mortality rate: 32.3 versus 32.6 per 100,000, respectively) (3)NCI Surveillance, Epidemiology, and End Results Program. NCI SEER*Explorer. Accessed: March 17, 2024. . Similarly encouraging trends are apparent for narrowing disparities in deaths attributed to prostate cancer among Black men and to cervical cancer among Black women.
Despite the progress, the Black population continues to shoulder a higher burden of cancer compared to the White population. Compared to any other racial or ethnic group, Black people have the highest incidence of cancer and the highest death rate for the disease (see Table 1). During 2016–2020, the overall cancer mortality rates were 18 percent higher in Black men compared to White men, and 12 percent higher in Black women compared to White women (2)Islami F, et al. (2023) CA Cancer J Clin, 74: 136 [LINK NOT AVAILABLE]. Compared to White individuals, in 2016–2020, Black individuals overall were at double or higher risk of dying from myeloma, stomach, and prostate cancers (3)NCI Surveillance, Epidemiology, and End Results Program. NCI SEER*Explorer. Accessed: March 17, 2024. .
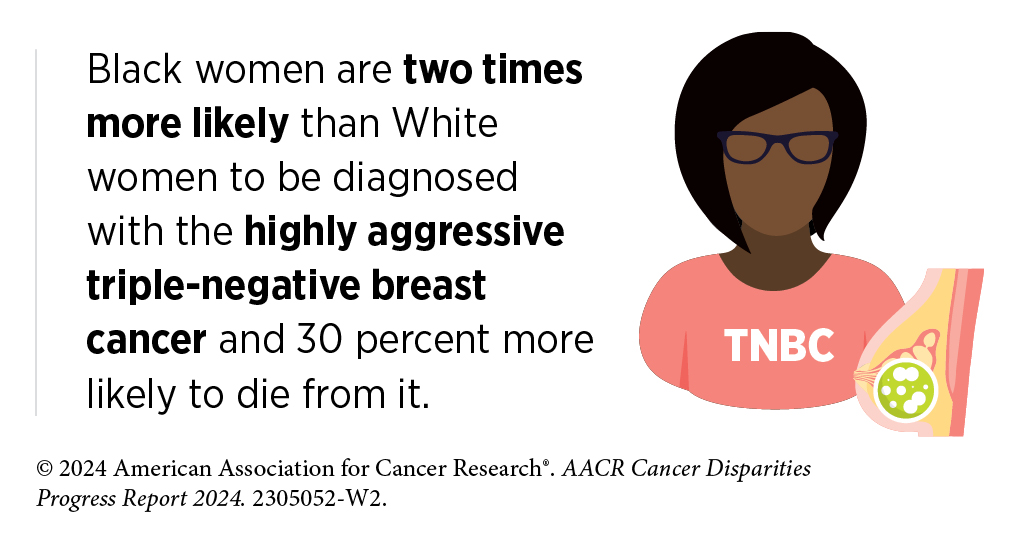
Concerning disparities in the burden of prostate cancer exist for Black men, who are at a 65 percent higher risk of developing prostate cancer and are at a more than double the risk of dying from it, compared to NH White men. Black women have a 6 percent lower likelihood of developing breast cancer but are at a 40 percent higher risk of dying from it, compared to NH White women. Compared to women of any other racial or ethnic background, Black women, such as Katrece Nolen, are also two times more likely to be diagnosed with inflammatory breast cancer, an aggressive form of breast cancer (29)Stringer-Reasor EM, et al. (2021) Am Soc Clin Oncol Educ Book, 41: e29. [LINK NOT AVAILABLE]. Another stark disparity exists in the burden of uterine cancer, for which Black women have about the same incidence rate as White women but double the likelihood of dying from it (3)NCI Surveillance, Epidemiology, and End Results Program. NCI SEER*Explorer. Accessed: March 17, 2024. .
The US Black population includes those born in the United States as well as those who have immigrated to the country and trace their ancestral roots to any of the Black racial groups of Africa and the African diaspora. Significant disparities in cancer burden exist within these subgroups, in part because of different exposure to cancer risk factors. A recent study found markedly different rates of lung cancer incidence in different subgroups within the Black population in Florida between 2012 and 2018 (30)Cranford HM, et al. (2023) Cancers (Basel), 15. 2165. [LINK NOT AVAILABLE]. Overall, lung cancer incidence in Black men was more than three times higher among those born in the United States compared to those born in the Caribbean. The study also found that US-born Black women with lung cancer had more than twice and three times the diagnoses of highly aggressive squamous cell carcinoma and small cell carcinoma, respectively, compared to those who are Caribbean-born (30)Cranford HM, et al. (2023) Cancers (Basel), 15. 2165. [LINK NOT AVAILABLE].
Cancer disparities faced by the Black population stem from a long history of structural racism, prejudice, and discrimination that have resulted in adverse social drivers of health (conditions within which people live, work, play), low socioeconomic status (SES), and inadequate access to quality health care (see Understanding and Addressing Drivers of Cancer Disparities), thus impeding the upward economic mobility of Black people.
Hispanic or Latino/a Population
| At A Glance: Hispanic or Latino/a Population in 2020* |
| Number and proportion of the US population†: 62.1 million people or 19 percent New cancer cases‡: 140,609 Cancer deaths‡: 43,942 Most common cancers§: Female breast, prostate, and colon and rectum cancers Most common causes of cancer deaths§: Lung and bronchus, prostate, and female breast cancers |
*Most recent year/timeframe for which such data are available.
†Based on the Census 2020.
‡Data indicate reported numbers for 2020 (4).
§2016–2020, most recent timeframe for which such data are available.
The Hispanic population is one of the fastest-growing and most diverse ethnic groups in the United States, representing many races, religions, languages, countries of origin, and cultural identities. Because most US cancer data for the Hispanic population are reported in the aggregate, descriptions of incidence and mortality rates do not account for important differences among diverse subgroups within the population (see Sidebar 4). Furthermore, it is well known that Hispanic individuals in the United States have a higher life expectancy compared to NH White individuals despite having lower income, inadequate health care, and higher exposure to certain risk factors, a phenomenon called the “Hispanic Paradox” (31)Markides KS, et al. (1986) Public Health Rep, 101: 253. [LINK NOT AVAILABLE](32)Fernandez J, et al. (2023) Journal of Economic Perspectives, 37: 145. [LINK NOT AVAILABLE]. Comprehensive and disaggregated health data on the population can help facilitate understanding the true burden of disparities, including cancer disparities (see Sidebar 4).
During 2016–2020, Hispanic people had the second lowest overall rates of cancer incidence and mortality compared to any other race or ethnicity (3)NCI Surveillance, Epidemiology, and End Results Program. NCI SEER*Explorer. Accessed: March 17, 2024. . A recent study showed that cancer deaths among Hispanic people declined by 1.3 percent every year between 1999 and 2020. The study also found that the decline rate in cancer deaths was faster in Hispanic men than Hispanic women (1.6 percent vs. 1.0 percent per year, respectively) (33)Pompa IR, et al. (2023) JAMA Oncol, 9: 1090. [LINK NOT AVAILABLE].
The Hispanic population shoulders a significantly higher burden of cancers, especially those associated with infectious agents, such as liver and stomach cancer. For example, compared to the White population during 2016–2020, Hispanic people had an 85 percent higher likelihood of being diagnosed with stomach cancer and more than double the likelihood of dying from it (see Table 1) (3)NCI Surveillance, Epidemiology, and End Results Program. NCI SEER*Explorer. Accessed: March 17, 2024. . Hispanic people were also twice as likely as White people to be diagnosed with liver cancer and 56 percent more likely to die from it (see Table 1) (3)NCI Surveillance, Epidemiology, and End Results Program. NCI SEER*Explorer. Accessed: March 17, 2024. . Furthermore, the incidence of early-onset colorectal cancer between 2015 and 2019, while increasing for all racial and ethnic minority populations, has increased the most in the Hispanic population, with a 5.8 percent annual increase in incidence compared to a 1.6 percent annual increase in incidence in the White population (3)NCI Surveillance, Epidemiology, and End Results Program. NCI SEER*Explorer. Accessed: March 17, 2024. .
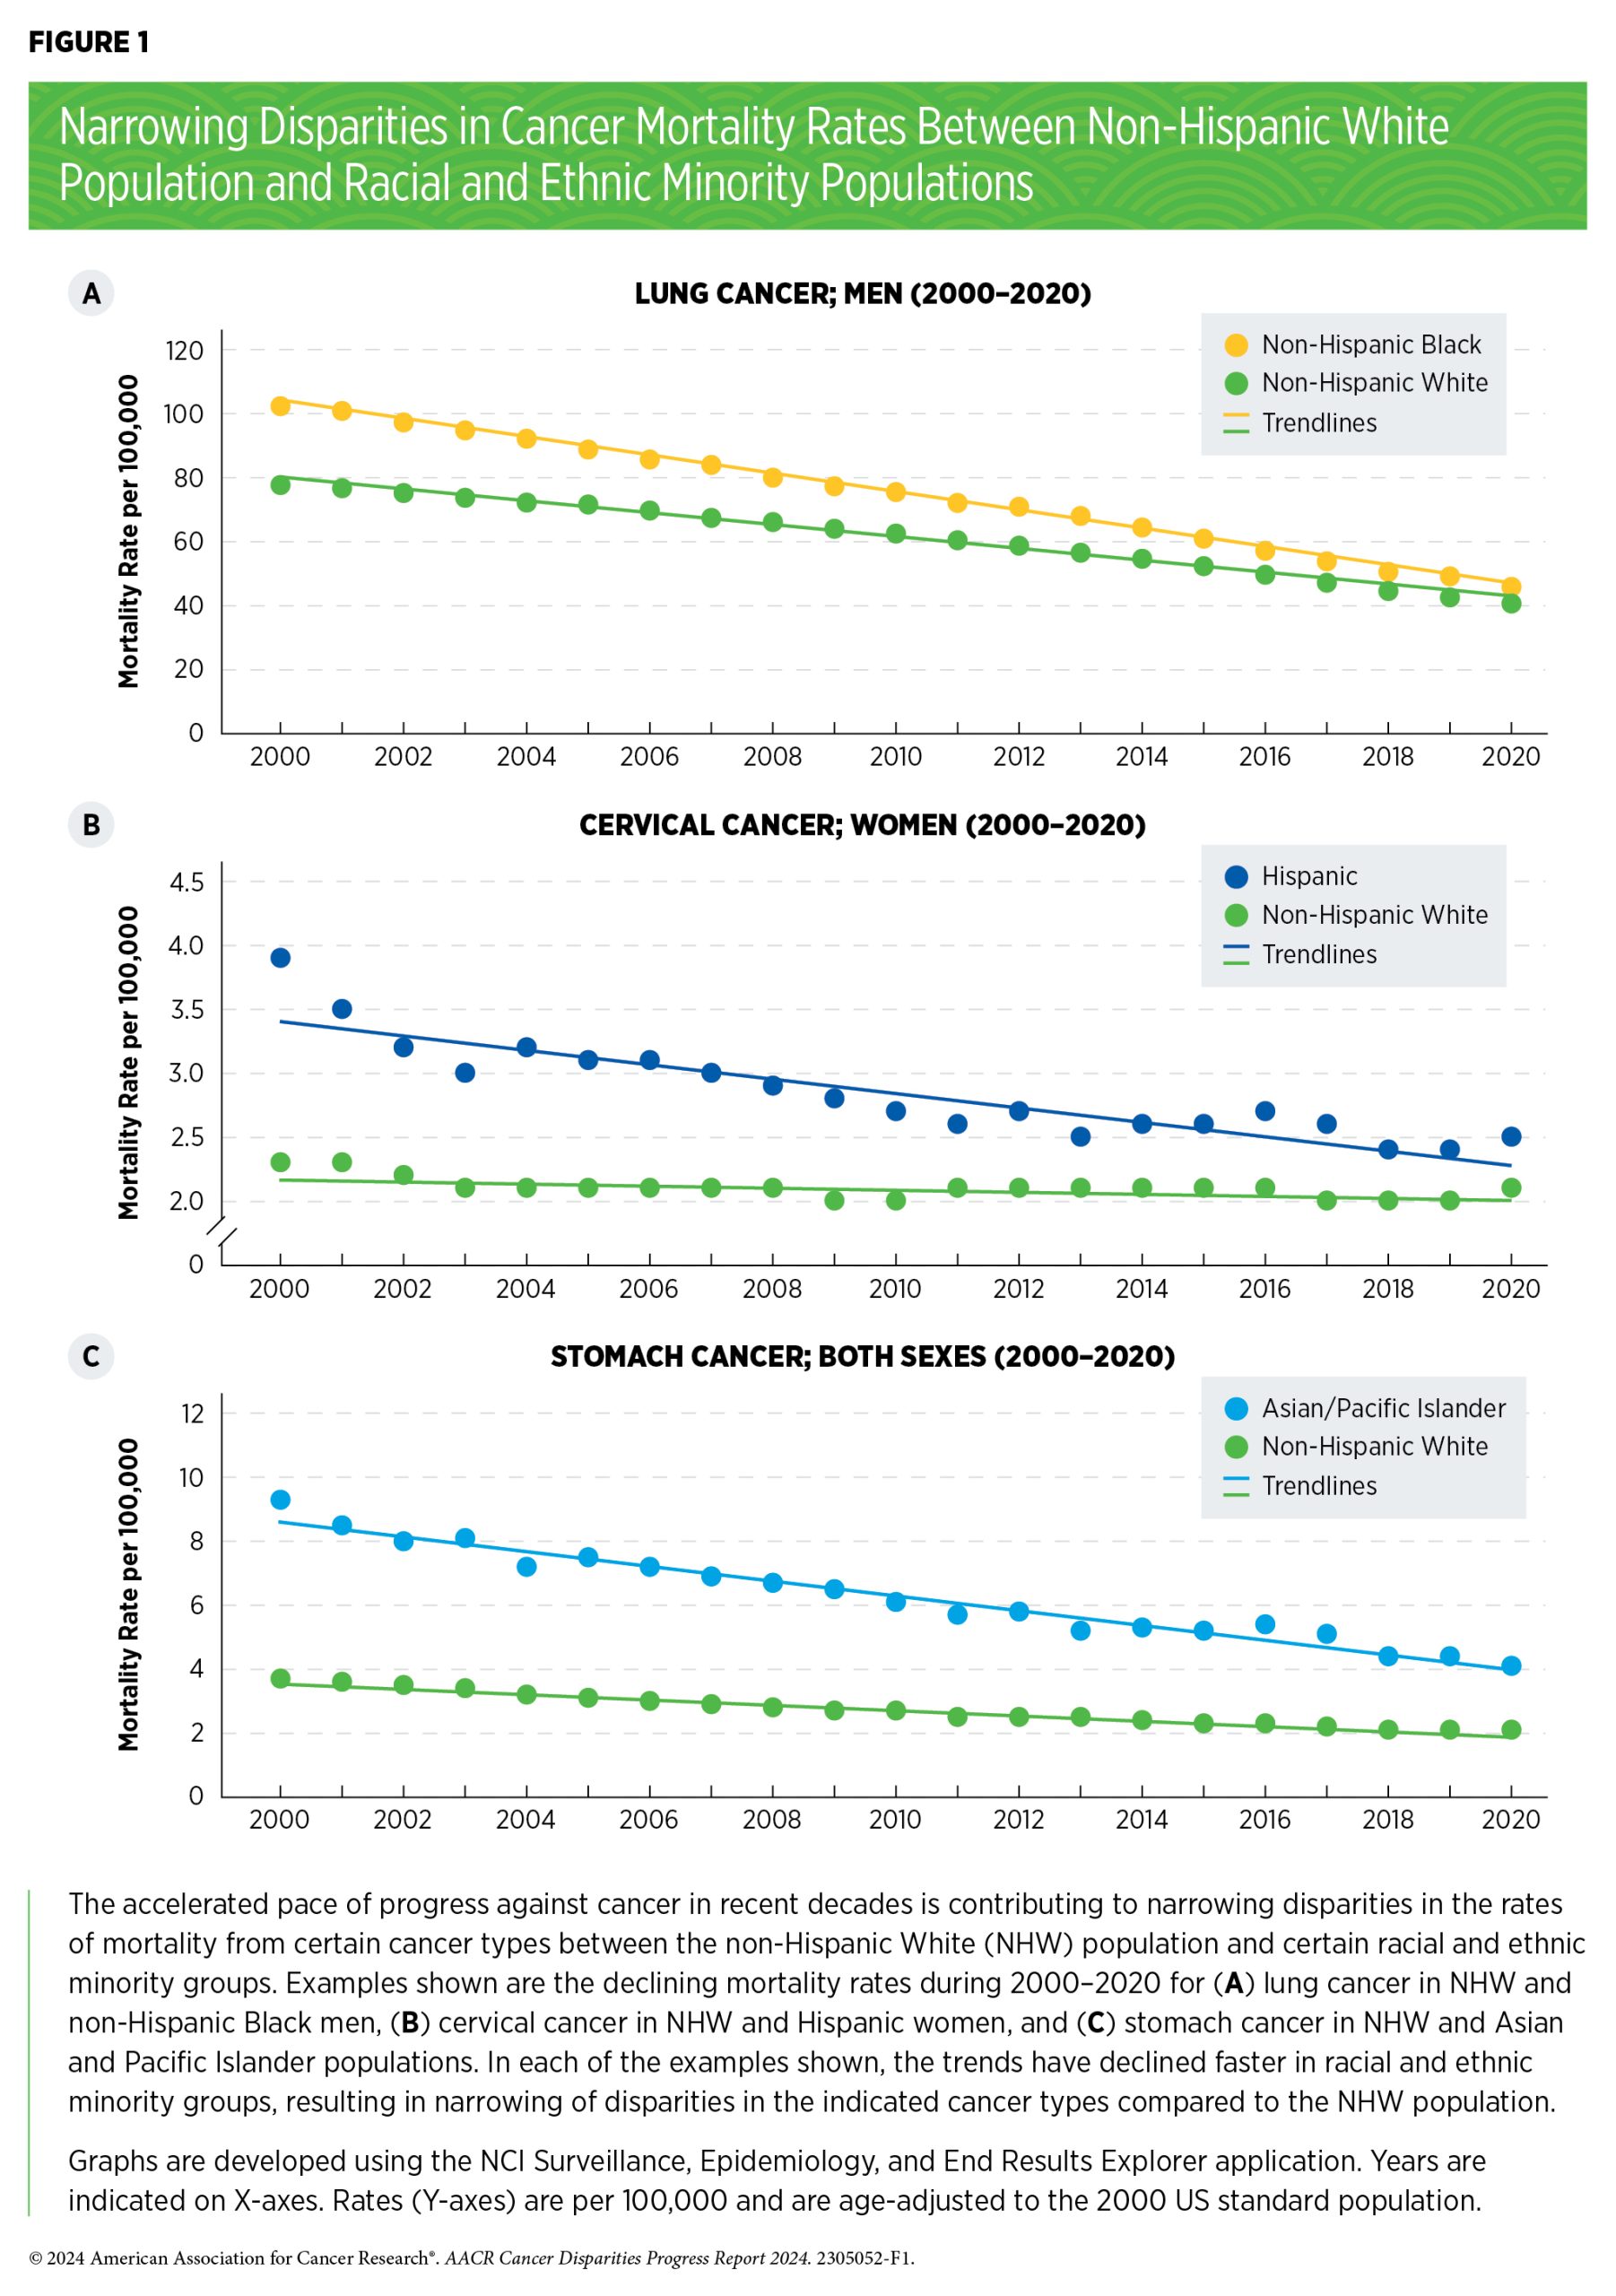
Another concerning trend during 2016–2020 was the disparity in the burden of cervical cancer between Hispanic and White women (3)NCI Surveillance, Epidemiology, and End Results Program. NCI SEER*Explorer. Accessed: March 17, 2024. . Compared to White women, Hispanic women are 43 percent more likely to be diagnosed with cervical cancer (see Table 1). Further concerning are the trends showing that, compared to NH White women, Hispanic women are more likely to be diagnosed at advanced stages of cervical cancer that has spread to nearby (56 percent more likely) or distant (44 percent more likely) organs (3)NCI Surveillance, Epidemiology, and End Results Program. NCI SEER*Explorer. Accessed: March 17, 2024. . Although the disparity in mortality from cervical cancer has narrowed in recent decades (see Figure 1), Hispanic women are still 25 percent more likely to die from it, compared to NH White women (see Table 1) (3)NCI Surveillance, Epidemiology, and End Results Program. NCI SEER*Explorer. Accessed: March 17, 2024. .
Hispanic youths are another segment of the Hispanic population shouldering a disproportionate burden of cancer. For example, a recent study of children (ages 0–14) and adolescents and young adults (ages 15–30) with B-cell acute lymphoblastic leukemia (B-ALL) found that Hispanic patients with B-ALL were 41 percent more likely to have disease recurrence within 5 years of enrollment in the study compared to NH White patients (34)Gupta S, et al. (2023) Lancet Haematol, 10: e129. [LINK NOT AVAILABLE]. Another study found that between 2001 and 2011, cancer deaths among Hispanic and White children and youth (ages 0 to 19) declined at about the same rate (14.7 percent versus 16.8 percent decline, respectively.) However, between 2011 and 2021, the decline in cancer deaths slowed by half for Hispanic youth compared to White youth (5.6 percent versus 12.3 percent decline, respectively), widening a disparity in death rates between the two populations (35)Centers for Disease Control and Prevention. Declines in Cancer Death Rates Among Youth: United States, 2001-2021. Accessed: Mar 13, 2024. .
The US Hispanic population comprises nearly two dozen subgroups based on country of origin and cultural heritage, among other factors. According to the US Census 2020, eight Hispanic groups reached a population of one million or more, with the Mexican population constituting the largest subgroup of Hispanic people. Cancer burden differs significantly within the Hispanic subgroups, largely attributable by country of origin, generation, and the length of time in the United States (36)Miller KD, et al. (2021) CA Cancer J Clin, 71: 466. [LINK NOT AVAILABLE].
A recent study found that Hispanic men had a 16 percent higher likelihood of being diagnosed with advanced-stage prostate cancer compared to NH White men (37)Swami N, et al. (2023) Prostate Cancer Prostatic Dis, 26: 309. [LINK NOT AVAILABLE]. However, there were stark differences in burden of prostate cancer among Hispanic subgroups. For example, when disaggregated by country of origin, Mexican Hispanic men were 26 percent more likely, while Cuban Hispanic men were 3 percent less likely, to be diagnosed with advanced-stage prostate cancer (37)Swami N, et al. (2023) Prostate Cancer Prostatic Dis, 26: 309. [LINK NOT AVAILABLE]. As another example, the overall incidence of prostate cancer is 18 percent lower in Hispanic men compared to White men, but 44 percent higher in men residing in Puerto Rico, which is predominantly Hispanic (38)Siegel RL, et al. (2024) CA Cancer J Clin, 74: 12. [LINK NOT AVAILABLE].
Another example of differences in the burden of cancer within Hispanic populations is the incidence and mortality rates in women who reside in Puerto Rico (39)Rosario-Santos A, et al. (2023) Gynecol Oncol Rep, 49: 101275. [LINK NOT AVAILABLE]. A recent study found that, during 2014–2018, women from Puerto Rico had the highest incidence of endometrial cancer (41.3 per 100,000 cases) across all racial and ethnic minority populations; in comparison, US Hispanic women had the lowest incidence rate (34.2 per 100,000 cases). Furthermore, mortality from endometrial cancer among Puerto Rican women increased 2.1 percent annually, second only to NH Black women, who had a 3.2 percent annual increase in mortality from endometrial cancer (39)Rosario-Santos A, et al. (2023) Gynecol Oncol Rep, 49: 101275. [LINK NOT AVAILABLE].
The reasons for disparities in cancer burden faced by the Hispanic population are manifold and arise from decades of systemic inequities and discrimination. Adverse social drivers of health (SDOH) have led to higher prevalence of infections from cancer-causing infectious agents, obesity, poor diet quality, sedentary lifestyle, lack of access to quality health care, all of which interact with ancestry-related biological differences, contributing to cancer disparities in the Hispanic populations (see Understanding and Addressing Drivers of Cancer Disparities and Disparities in the Burden of Preventable Cancer Risk Factors) (40)Fejerman L, et al. (2022) Cancer Epidemiol Biomarkers Prev, 31: 932. .
Native Hawaiian or Other Pacific Islander (NHOPI) Population
| At A Glance: Native Hawaiian or Other Pacific Islander Population |
| Number and proportion of the US population*: Estimated 690,000 people or about 0.2 percent State of Hawai‘i (2014–2018)†‡ New cancer cases: 7,393 per year Cancer deaths: 2,392 per year Most common cancers: Female breast, prostate, and colorectal cancers Most common causes of cancer deaths: Lung and bronchus, prostate, and female breast cancers US-affiliated Pacific Islands (2007–2020)†§ New cancer cases: 7,652 total Cancer deaths¶: Data not available Most common cancers: Female breast, lung and bronchus, and colorectal cancers Most common causes of cancer deaths¶: Data not available |
*Based on the Census 2020.
†Most recent year/timeframe for which such data are available.
‡Data source: Report from Hawai‘i Tumor Registry (41).
§Data source: Report from Pacific Regional Central Cancer Registry (13).
¶The report does not document cancer mortality rates due to ongoing challenges with reporting and recording of deaths in the US-affiliated Pacific Islands.
The Native Hawaiian or Other Pacific Islander (NHOPI) population includes more than 25 diverse groups with distinct variations in historical backgrounds, languages, immigration and colonization experiences, and cultural traditions. The NHOPI racial group includes individuals with origins in any of the original peoples of Hawai‘i and the six US-affiliated Pacific Island jurisdictions: Guam, American Samoa, the Commonwealth of the Northern Mariana Islands, the Republic of the Marshall Islands, the Republic of Belau, and the Federated States of Micronesia.
In its 1997 mandate, the Office of Management and Budget (OMB) separated the Asian and Pacific Islander (API) populations into two distinct racial groups (see Sidebar 2). Despite this classification, NHOPI populations continue to be aggregated with Asian populations for data reporting in most national resources documenting cancer burden. Because there are fewer NHOPI individuals than Asian individuals (0.2 percent versus. 6 percent, respectively, of the US population in 2020), aggregated API data vastly mask cancer burden in the NHOPI population (see Sidebar 4). For example, the incidence rate per 100,000 cases of all HPV-associated cancers combined in men during 1990–2014 was 2.1 for Asian American men compared to 5.1 for NHOPI men; this difference was masked when Asian American and NHOPI men were combined (2.3 per 100,000 cases; (21)Shing JZ, et al. (2023) JNCI Cancer Spectr, 7: pkad012. [LINK NOT AVAILABLE]).
Researchers have uncovered cancer disparities between White, NHOPI, and Asian populations by analyzing disaggregated data. For example, aggregated data show API women are 22 percent less likely than NH White women to be diagnosed with, and 41 percent less likely to die from, breast cancer (see Table 1) (3)NCI Surveillance, Epidemiology, and End Results Program. NCI SEER*Explorer. Accessed: March 17, 2024. . However, a recent study evaluating rates of cancer mortality between 2018 and 2020 found that, compared to NH White women, Asian women were 42 percent less likely, but NHOPI women were 21 percent more likely, to die from breast cancer, unmasking a significant disparity (42)Haque AT, et al. (2023) J Natl Cancer Inst, 115: 822. [LINK NOT AVAILABLE]. Similarly concerning trends exist for the burden of uterine cancer. Compared to NH White women, API women are 20 percent less likely to die from uterine cancer. However, disaggregated data show that Asian women are 30 percent less likely, but NHOPI women are three times more likely, to die from uterine cancer (3)NCI Surveillance, Epidemiology, and End Results Program. NCI SEER*Explorer. Accessed: March 17, 2024. (42)Haque AT, et al. (2023) J Natl Cancer Inst, 115: 822. [LINK NOT AVAILABLE].
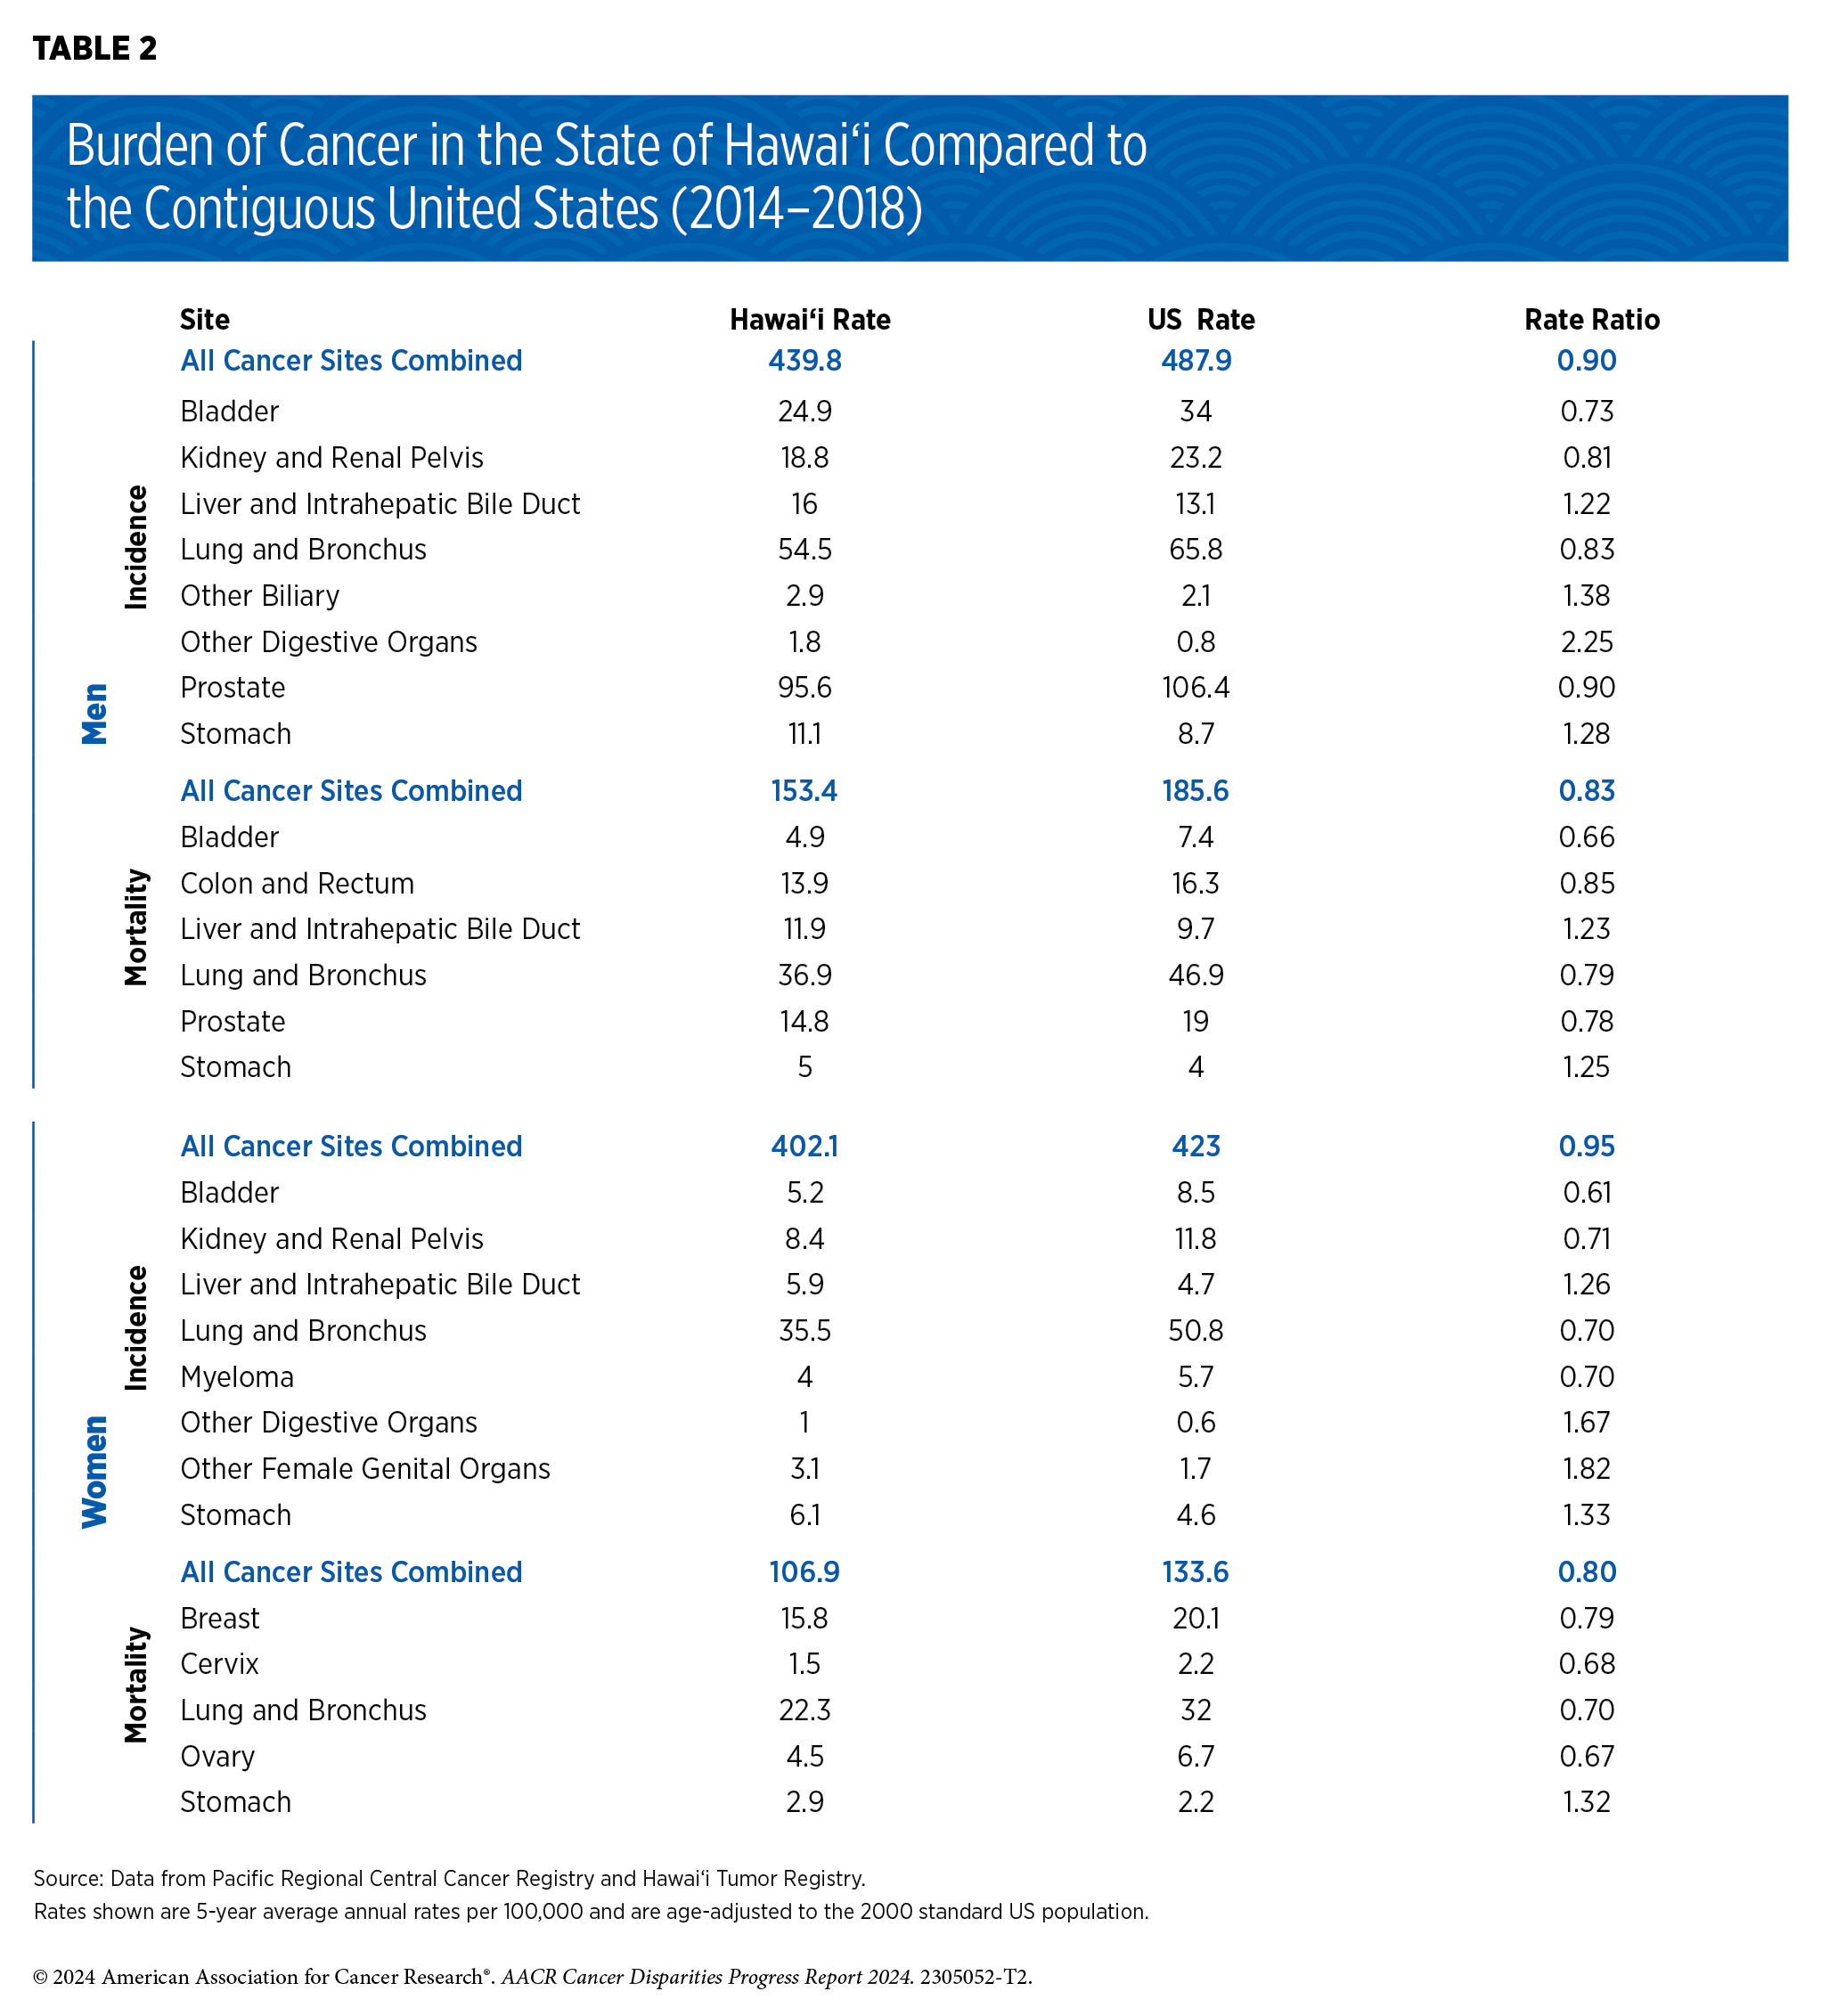
The Hawai‘i Tumor Registry—which is a part of the NCI Surveillance, Epidemiology, and End Results (SEER) program—periodically provides an overview of the cancer burden shouldered by the Hawaiian people. According to its most recent report, Hawai‘i Cancer at a Glance 2014–2018, released in 2022, Hawai‘i rates of incidence and mortality from all cancers combined were significantly lower for both men and women when compared to corresponding rates from the contiguous United States (41)University of Hawai‘i Cancer Center. Hawai‘i Cancer at a Glance 2012-2016. Accessed: March 17, 2024. . However, the burden of certain cancer types, such as stomach cancer, was substantially higher in the population of Hawai‘i (see Table 2). Compared to the contiguous US residents, women and men in Hawai‘i are 32.6 percent and 27.5 percent more likely to be diagnosed with stomach cancer, respectively. Furthermore, mortality rates of stomach cancer for Hawaiian women and men are 32 percent and 25 percent higher, respectively, compared to residents of the contiguous United States (41)University of Hawai‘i Cancer Center. Hawai‘i Cancer at a Glance 2012-2016. Accessed: March 17, 2024. . There is also substantial variation in the burden of breast cancer between Asian and NHOPI women living in Hawai‘i. Breast cancer incidence is higher among Native Hawaiian and Japanese American women compared to Chinese, Filipino, White, other Asian, and women of other racial and ethnic groups. Native Hawaiian women also have higher mortality than Chinese, Filipino, Japanese, White, and other Asian women (41)University of Hawai‘i Cancer Center. Hawai‘i Cancer at a Glance 2012-2016. Accessed: March 17, 2024. .
There are also considerable disparities based on the geographic location of residence and racial and ethnic origin among individuals living in the state of Hawai‘i. For example, the overall cancer mortality is highest in Native Hawaiian individuals compared to other populations in the state. Similarly, Native Hawaiian women have the highest mortality from, and second highest incidence of, invasive breast cancer compared to Chinese, Filipino, White, and other Asian women living in Hawai‘i (41)University of Hawai‘i Cancer Center. Hawai‘i Cancer at a Glance 2012-2016. Accessed: March 17, 2024. . Another example is the disparate burden of cancer among residents of different Hawaiian Islands. As one example, residents of Hawai‘i County have the second lowest rate of overall cancer incidence, but the highest rate of cancer mortality, compared to those living in other counties (41)University of Hawai‘i Cancer Center. Hawai‘i Cancer at a Glance 2012-2016. Accessed: March 17, 2024. .
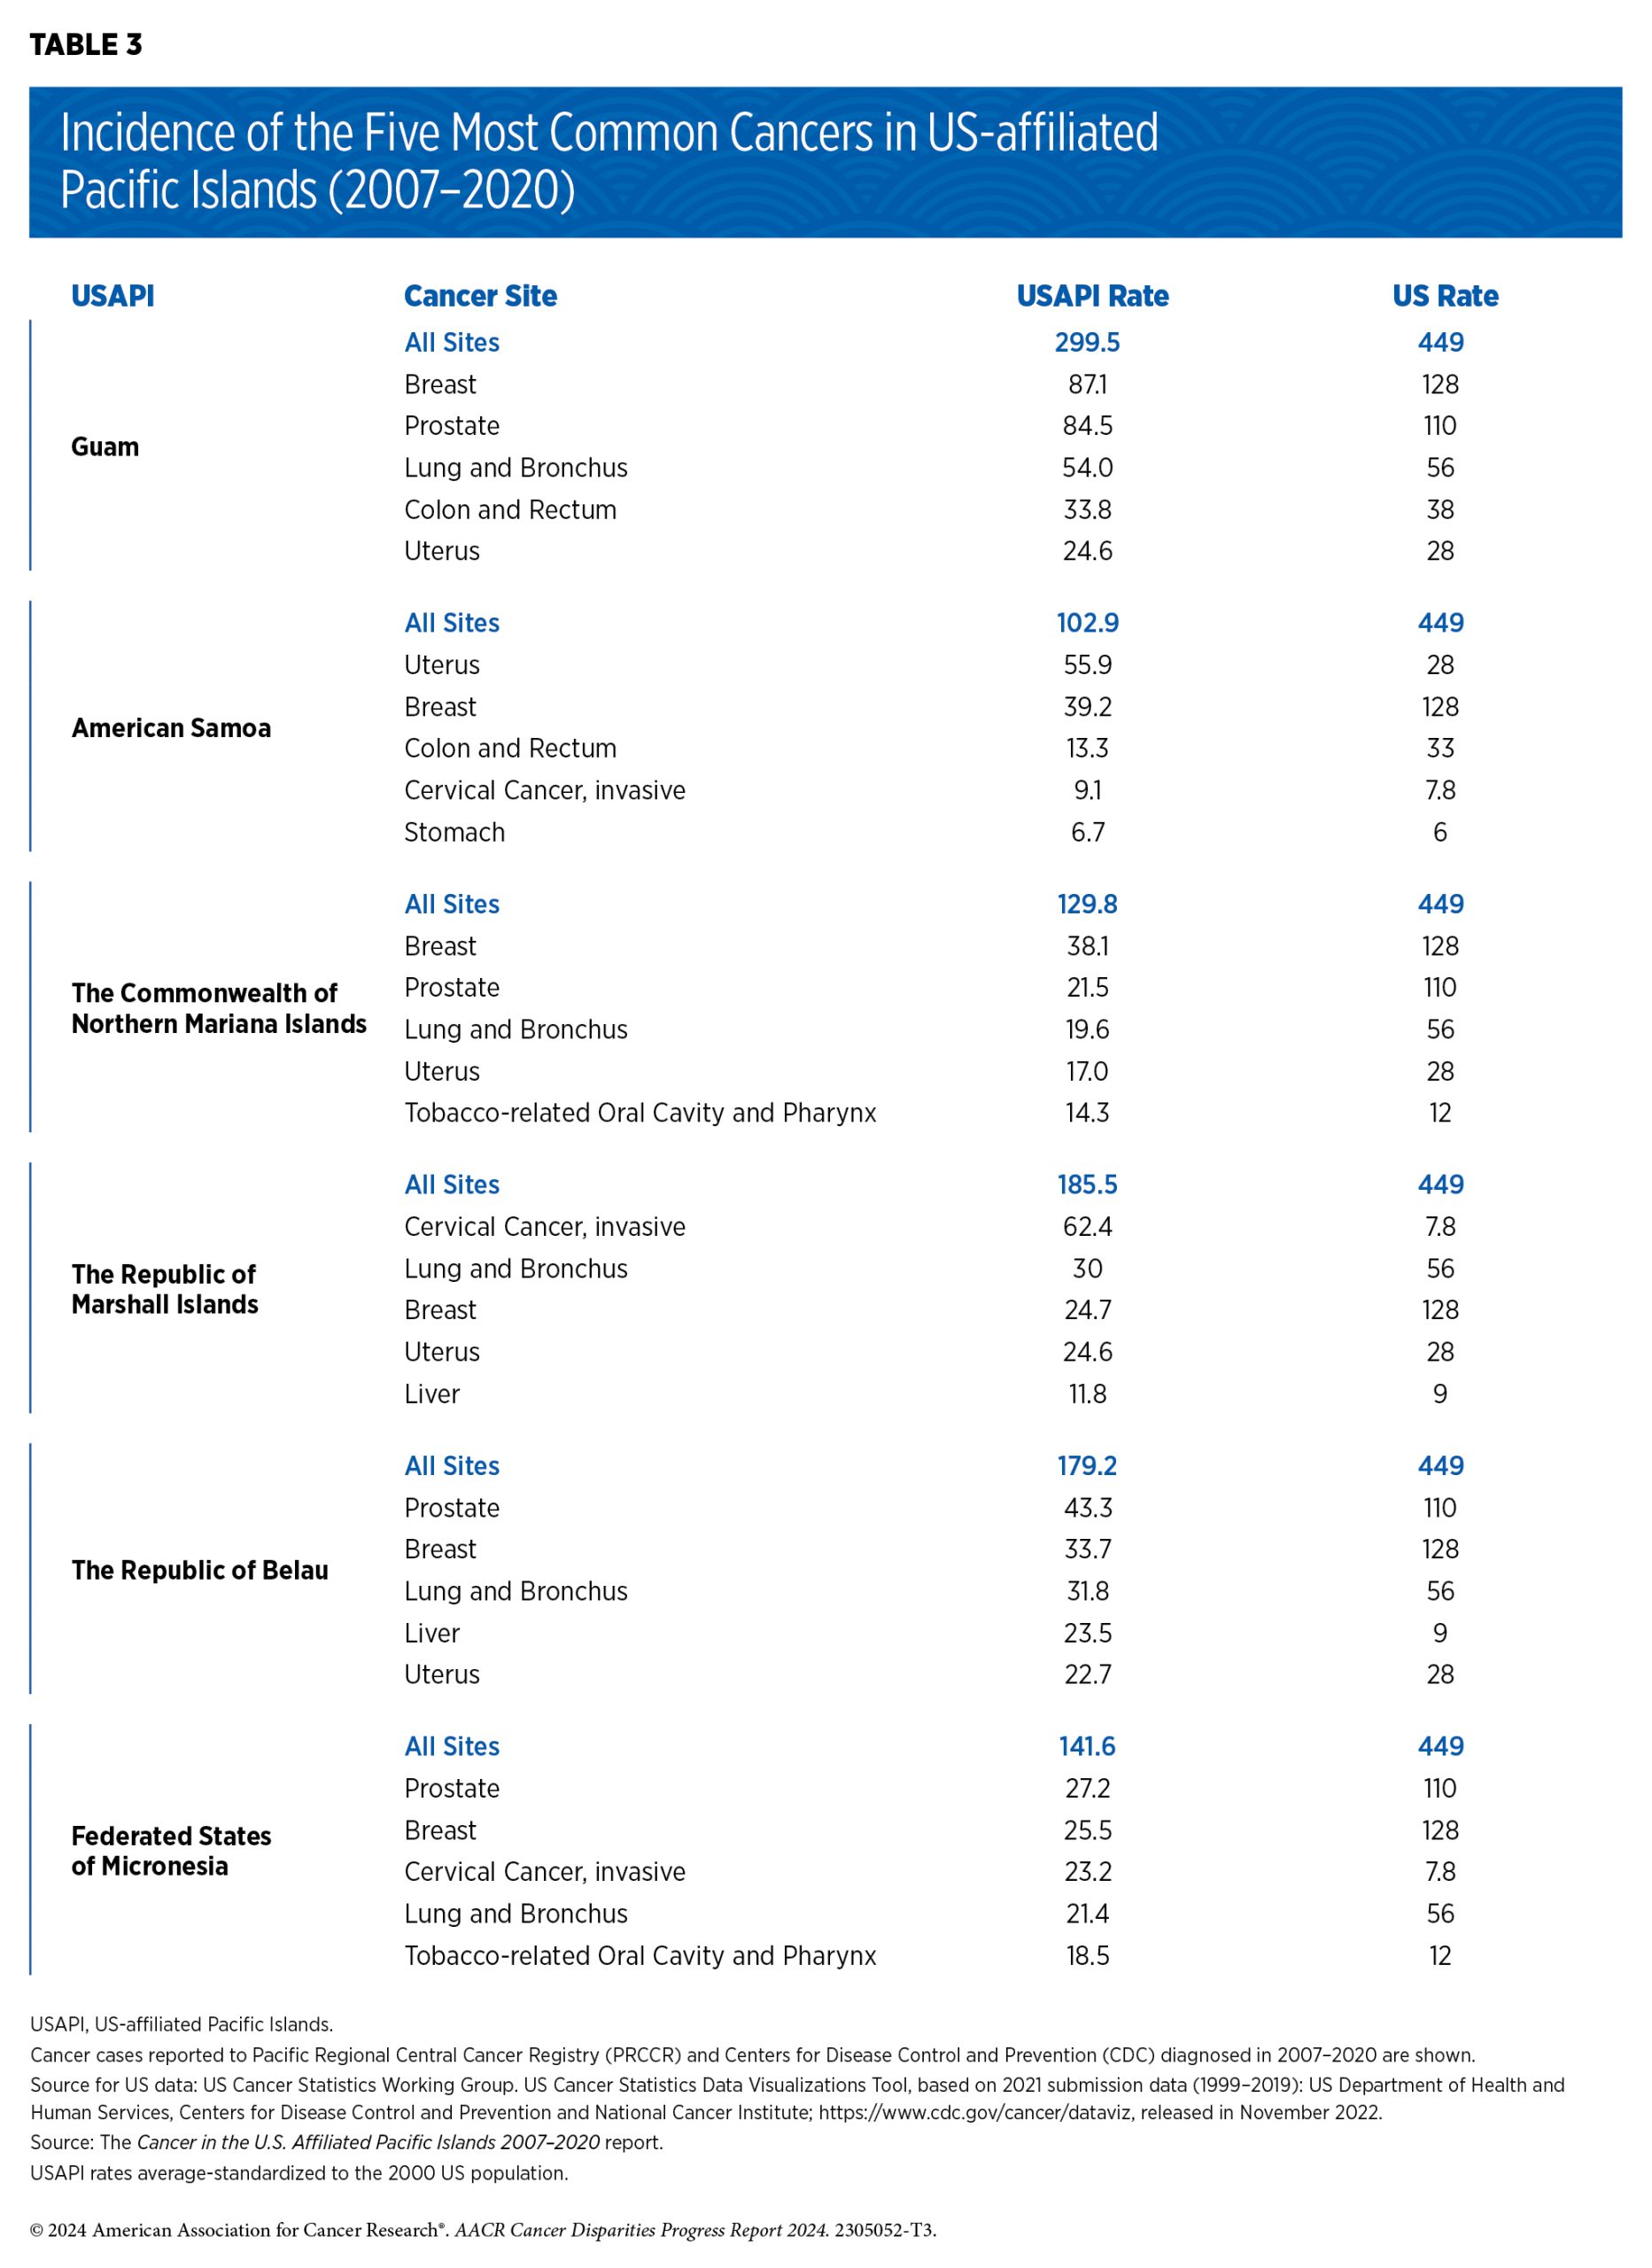
According to a recent report Cancer in the U.S. Affiliated Pacific Islands 2007–2020, released in 2022 by the Pacific Regional Central Cancer Registry, the incidence rate for all cancers combined in the US-affiliated Pacific Islands population during 2007–2020 was 51 percent less than that of the US population during 2015–2019 (13)Pacific Regional Central Cancer Registry. Cancer in the U.S. Affiliated Pacific Islands 2007-2020. Accessed: March 17, 2024. . Nearly all major cancer types, including cancers of lung and bronchus, female breast, and colon and rectum, had lower incidence rates in the US-affiliated Pacific Islands population. The only exception is liver cancer, which had a slightly higher incidence rate in the US-affiliated Pacific Islands population compared to the US population (10.7 versus 9.0 cases per 100,000, respectively) (13)Pacific Regional Central Cancer Registry. Cancer in the U.S. Affiliated Pacific Islands 2007-2020. Accessed: March 17, 2024. . Despite the overall lower incidence rates in the aggregated US-affiliated Pacific Islands population, there were substantial disparities among populations living in various US-affiliated Pacific Islands (see Table 3).
The Cancer in the U.S. Affiliated Pacific Islands 2007–2020 report does not document cancer mortality rates due to ongoing challenges with reporting and recording of deaths in the US-affiliated Pacific Islands. However, significant differences among various US-affiliated Pacific Island populations exist in 5-year relative survival rates for several cancer types. As one example, the 5-year relative survival rate for cervical cancer among women living in the Republic of Palau is about half that of those living in the Commonwealth of the Northern Mariana Islands (43 percent versus 82 percent, respectively), even though the age-standardized incidence of cervical cancer is almost similar (10 versus 11.4 cases per 100,000, respectively) (13)Pacific Regional Central Cancer Registry. Cancer in the U.S. Affiliated Pacific Islands 2007-2020. Accessed: March 17, 2024. .
The increasing prevalence of sedentary lifestyle, poor nutrition, and tobacco use among the NHOPI population is a key driver of cancer disparities. Furthermore, its geographic location and socioeconomic characteristics present unique structural barriers to accessing quality health care, which translates into underdiagnosis for most cancers and can further exacerbate the disproportionate cancer burden among the population.
Cancer Disparities Experienced by Other Medically Underserved Populations
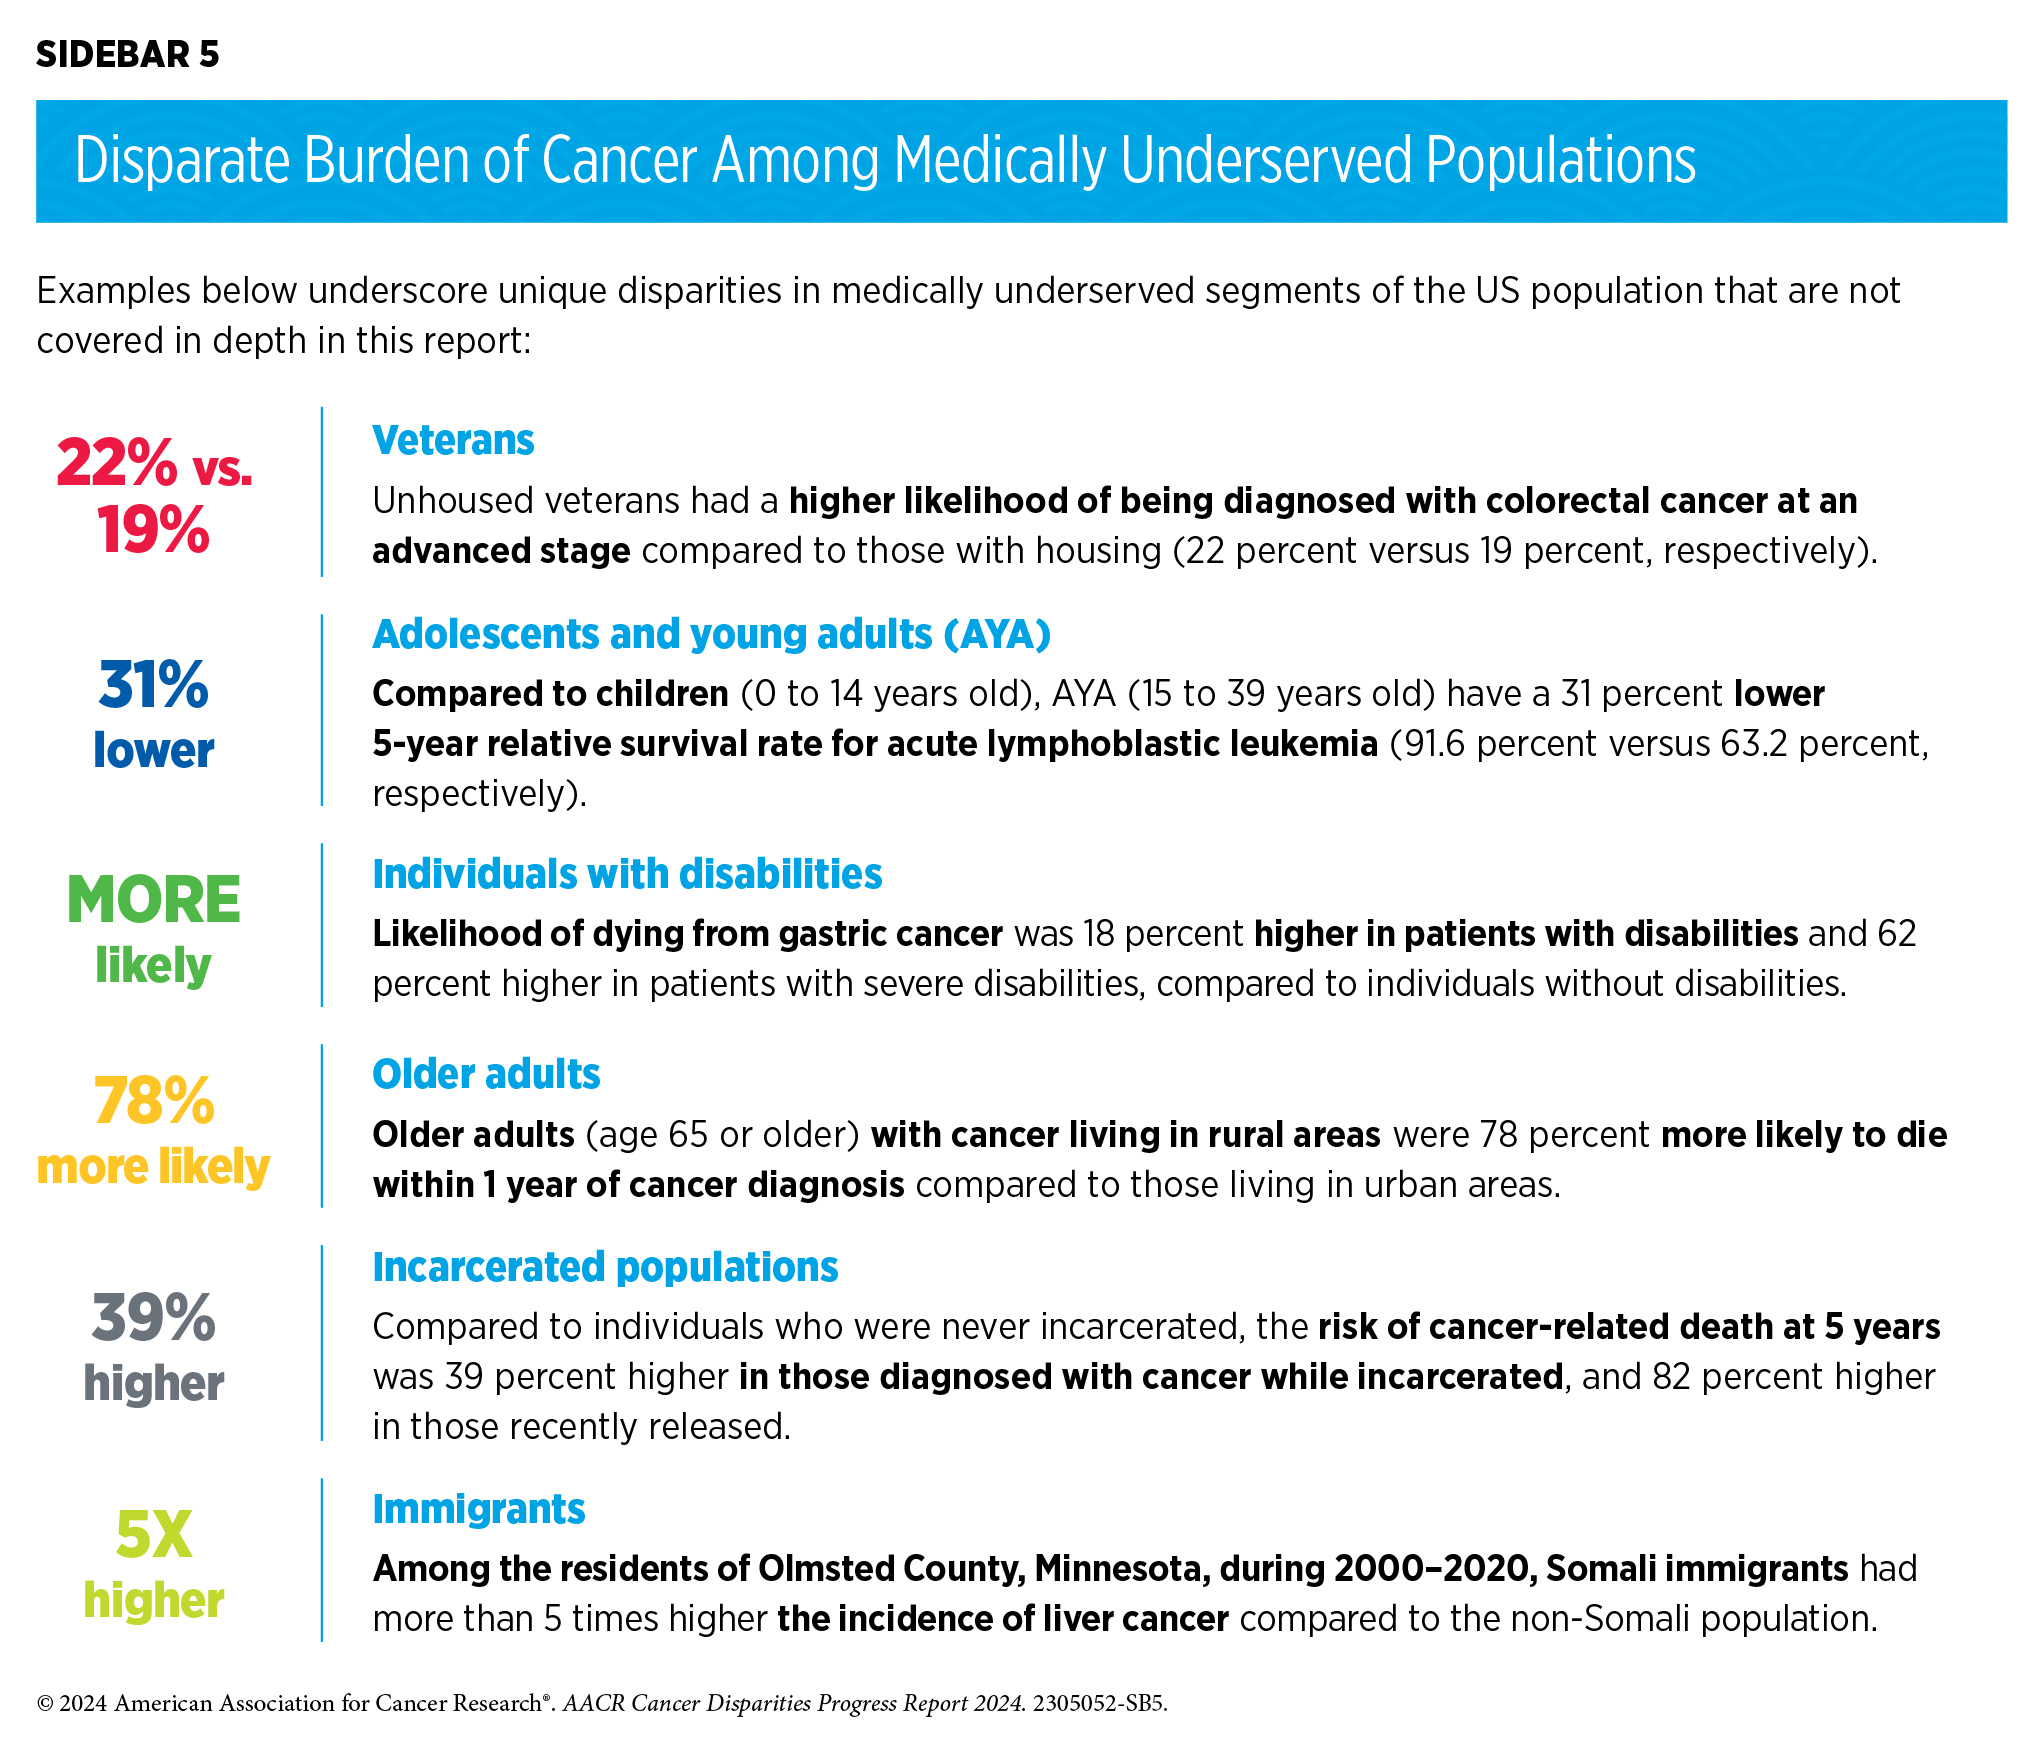
In addition to racial and ethnic minority groups, many segments of the US population remain medically underserved and shoulder a disproportionate burden of cancer. Factors that contribute to disparities in these populations include lack of access to quality cancer care, a higher prevalence of certain modifiable risk factors, residence in remote areas, barriers arising due to sexual orientation and gender identity, and persistent poverty. In addition, older adults, veterans, immigrants, individuals with disabilities, individuals who are incarcerated, adolescents and young adults all are medically underserved to varying degrees and face unique challenges in the burden of cancer (see Sidebar 5).
Populations Residing in Rural Areas
Multiple criteria distinguish rural or nonmetropolitan areas from urban or metropolitan counties. Based on the 2023 Rural-Urban Continuum Codes developed by the US Department of Agriculture Economic Research Services, an estimated 15 percent of the US population and 74 percent of US counties reside in rural or nonmetropolitan areas (49)US Department of Agriculture. Economic Research Service. Rural-Urban Continuum Codes. Accessed: March 17, 2024. . Although less racially and ethnically diverse compared to urban or metropolitan counties, rural populations tend to have lower socioeconomic status and face unique challenges in access to quality cancer care, prevention, and screening. According to the National Health Interview Survey, 11.3 percent of individuals with a history of cancer were living in rural or nonmetropolitan areas of the United States in 2022 (50)National Center for Health Statistics. Percentage of any type of cancer for adults aged 18 and over, United States, 2019—2022. Accessed: March 17, 2024. .
During 2016–2020, cancer incidence rates were slightly higher in residents of nonmetropolitan or rural areas, compared to those living in large (one million or more residents) and medium (fewer than one million residents) metropolitan or urban areas (460.8 versus 431.7 versus 446.9 cases per 100,000, respectively) (2)Islami F, et al. (2023) CA Cancer J Clin, 74: 136 [LINK NOT AVAILABLE]. There are significant disparities between rural and urban residents in the burden of certain cancer types. For example, a recent study covering the 2000–2017 time period found that rural residents have 19 percent higher likelihood of dying from melanoma (51)Hernandez AE, et al. (2023) Am Surg, 90: 510. [LINK NOT AVAILABLE]. Similarly, another study found that, between 1999 and 2020, mortality from all cancers combined decreased at a faster pace in urban residents compared to rural residents—1.96 percent versus 1.43 percent yearly decline among men living in urban versus rural areas, respectively, and 1.56 percent versus 0.93 percent yearly decline among women living in urban versus rural areas (52)Sokale IO, et al. (2023) Cancer Med, 12: 18988. [LINK NOT AVAILABLE].
During the most recent 2016–2020 time period for which such data are available, residents of nonmetropolitan or rural counties were 38 percent more likely to be diagnosed with and die from lung cancer, compared to those living in large metropolitan or urban areas (2)Islami F, et al. (2023) CA Cancer J Clin, 74: 136 [LINK NOT AVAILABLE]. Similarly, cervical cancer, which is potentially preventable, has a disparate burden among residents of rural areas. Women age 65 or younger, living in nonmetropolitan or rural areas, had 37 percent higher incidence of, and 39 percent higher mortality from, cervical cancer, compared to those living in urban or metropolitan areas (2)Islami F, et al. (2023) CA Cancer J Clin, 74: 136 [LINK NOT AVAILABLE], in part due to lower vaccination rates and lower screening rates (see Disparities in the Burden of Preventable Cancer Risk Factors).
Intersectionality encompasses the complex ways in which the effects of multiple forms of discrimination (such as racism, sexism, and classism) combine, overlap, or intersect especially in the lived experiences of marginalized individuals or groups, and is an important consideration when discussing the burden of cancer in medically underserved populations, including rural residents. For example, an individual residing in a rural area and belonging to a racially or ethnically minoritized group shoulders a disproportionate cancer burden attributable to multiple factors that adversely impact their lived experiences. According to the 2020 US Census, about 24 percent of rural residents belong to racially or ethnically minoritized groups who face unique cancer disparities such as higher rates of incidence and mortality for certain cancer types (see Cancer Disparities Experienced by US Racial and Ethnic Minority Populations).
It is important to note that 85 percent of counties under persistent poverty are rural (54)US Department of Agriculture. Rural America at a Glance. 2023 Edition. Accessed: March 26, 2024. (see Populations Living Under Poverty). Because of these sociodemographic characteristics, people living in rural areas have fewer opportunities to improve their socioeconomic status; experience higher exposure to certain environmental and other cancer risk factors; face barriers in access to health care, particularly specialty cancer care; and have sparse access to high-speed Internet and state-of-the-art medical facilities (see Understanding and Addressing Drivers of Cancer Disparities) (54)US Department of Agriculture. Rural America at a Glance. 2023 Edition. Accessed: March 26, 2024. .
Populations Identifying as Sexual and Gender Minority
Sexual and gender minority (SGM) is an all-inclusive term used by the National Institutes of Health (NIH) and includes those who identify as lesbian, gay, bisexual, transgender, queer, intersex, asexual, and/or Two-Spirit; those with same-sex or same-gender attractions or behaviors; those with a difference in sex development; and those who do not self-identify with one of these terms but whose sexual orientation, gender identity or expression, or reproductive development is characterized by nonbinary constructs of sexual orientation, gender, and/or sex. According to a 2022 Pew Research Center Survey, about 7 percent of the US population self-identifies as belonging to the SGM populations (55)Pew Research Center. 5 key findings about LGBTQ+ Americans. Accessed: March 17, 2024. .
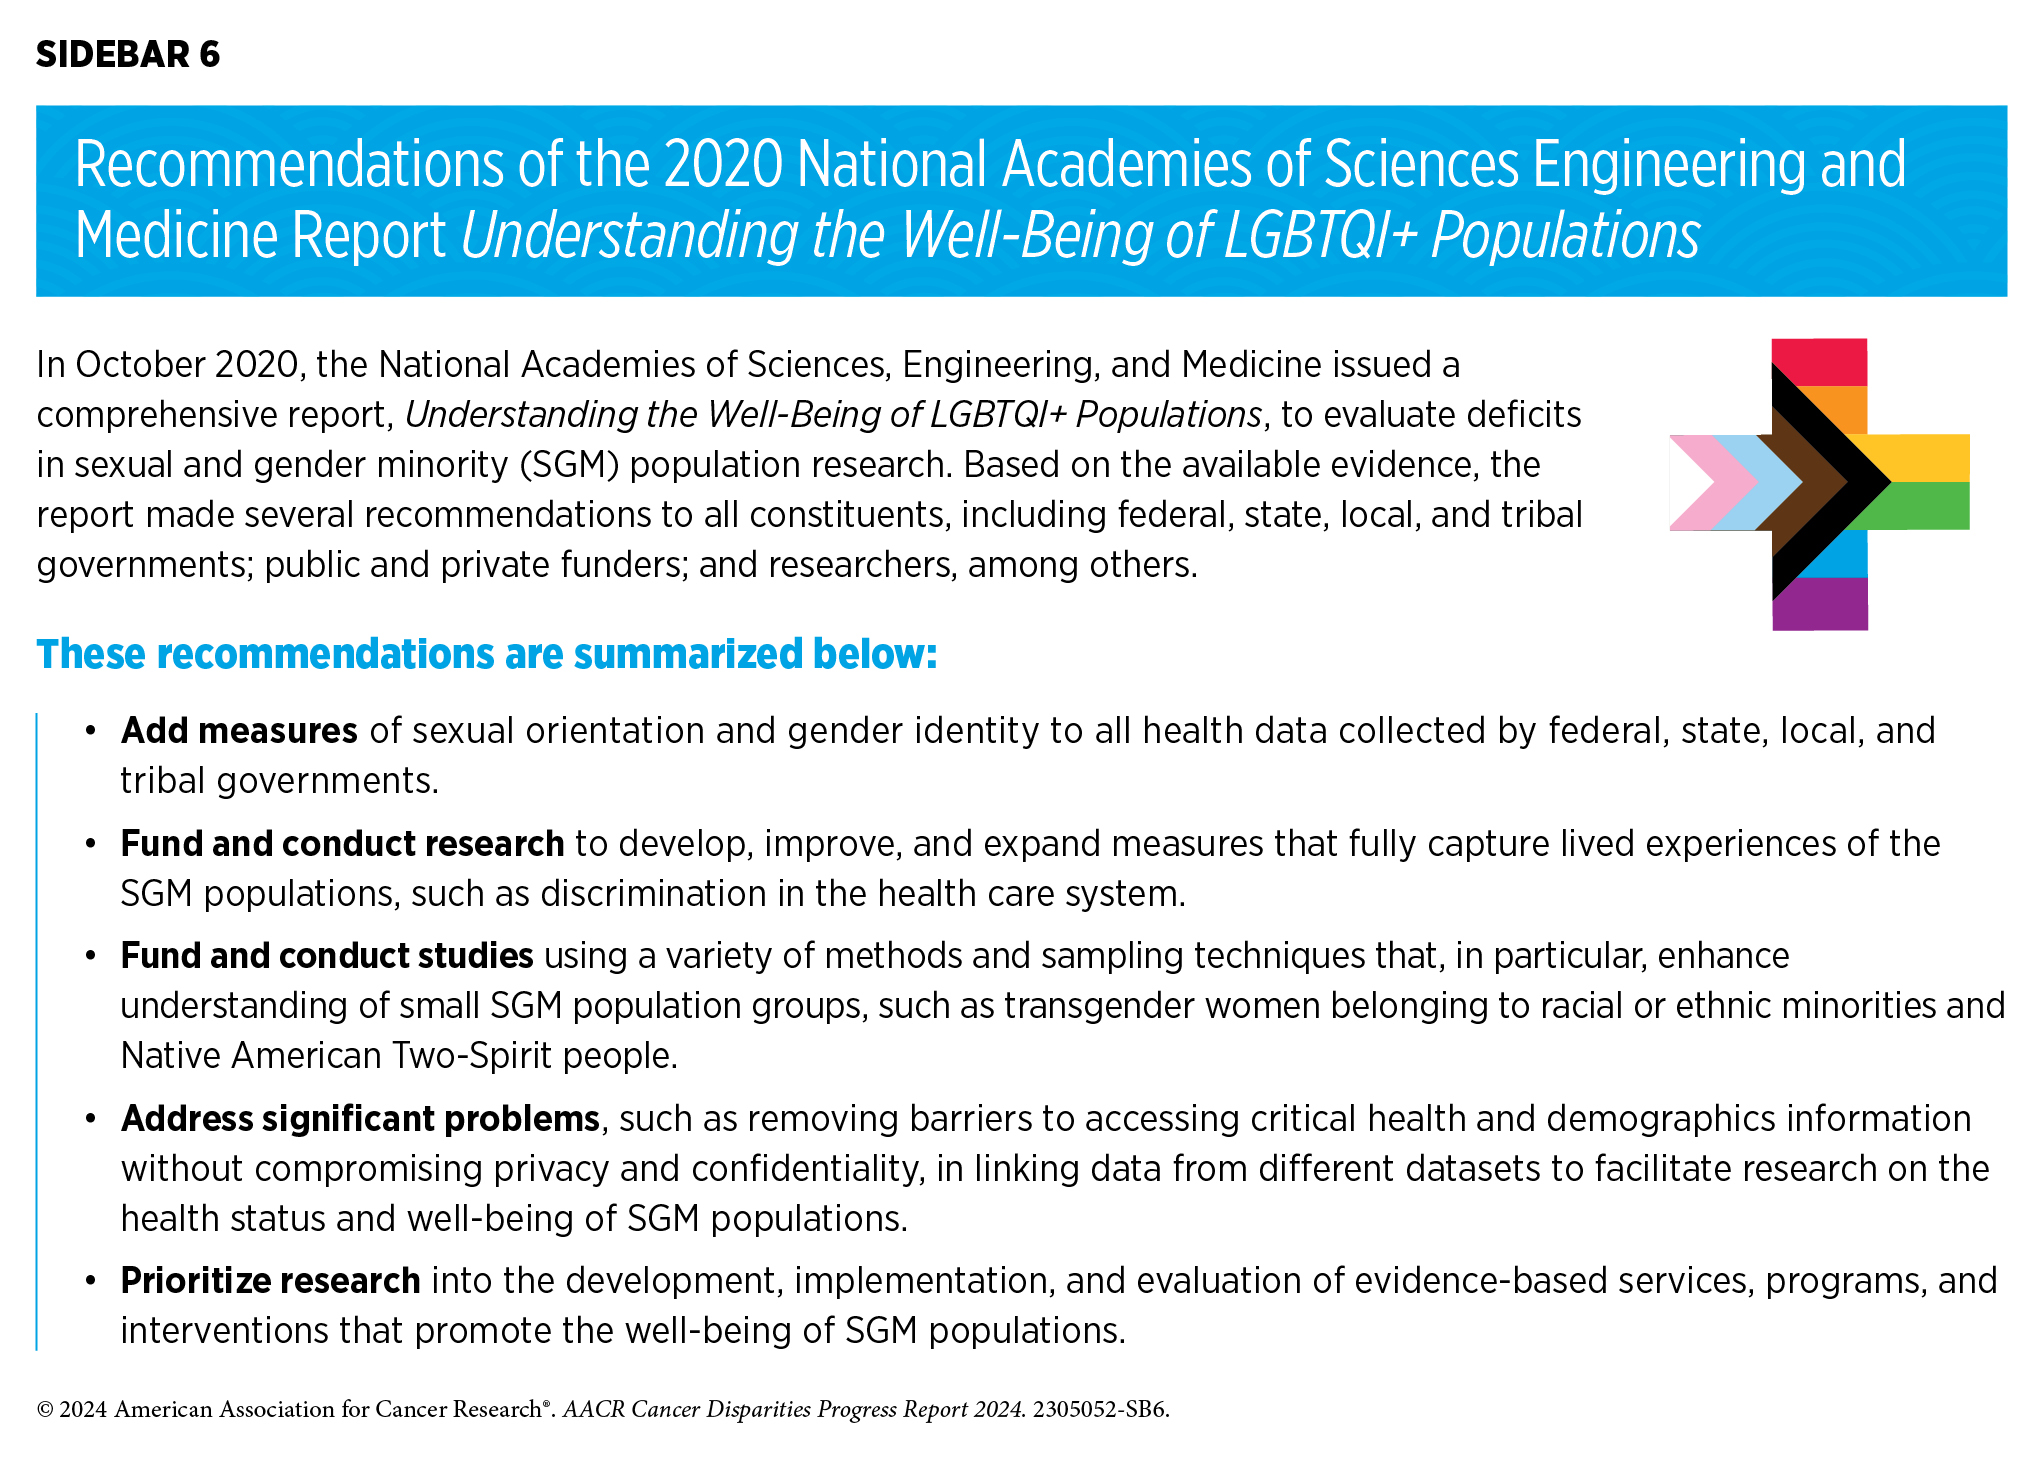
Comprehensive and population-level information about cancer incidence and mortality among SGM individuals is limited because sexual orientation and gender identity (SOGI) data historically have not been routinely collected and documented in national cancer registries and other health records. In the absence of population-level data, this report relies on relatively small studies that highlight cancer disparities experienced by SGM individuals (see Sidebar 6).
Evidence suggests that the risk of breast cancer is higher among sexual minority women compared to heterosexual women (57)Clavelle K, et al. (2015) Womens Health Issues, 25: 341. [LINK NOT AVAILABLE](58)Williams AD, et al. (2020) LGBT Health, 7: 109. [LINK NOT AVAILABLE]. Transgender individuals are at a 76 percent higher risk of being diagnosed with advanced-stage lung cancer compared to cisgender individuals (59)Jackson SS, et al. (2021) J Natl Cancer Inst, 113: 1221. [LINK NOT AVAILABLE]. However, specific findings to support higher incidence or risk of breast cancer among transgender relative to cisgender women are mixed (60)de Blok CJM, et al. (2019) BMJ, 365: l1652. [LINK NOT AVAILABLE](61)McFarlane T, et al. (2018) Clin Endocrinol (Oxf), 89: 700. [LINK NOT AVAILABLE](62)Raths F, et al. (2023) Cell Genom, 3: 100272. [LINK NOT AVAILABLE](63)Brown GR, et al. (2015) Breast Cancer Res Treat, 149: 191. [LINK NOT AVAILABLE]. Similarly, the interplay between hormone therapy—an essential component of gender-affirming care for many transgender individuals (64)Unger CA (2016) Transl Androl Urol, 5: 877. [LINK NOT AVAILABLE]—and the likelihood of developing cancer is not clear.
A recent review of the current literature suggests that gay and bisexual men are at a higher risk of developing prostate cancer (65)Yazdanpanah O, et al. (2023) Cancers (Basel), 15: 2654. [LINK NOT AVAILABLE]. Another study found that, compared to cisgender men, transgender women appear to be at a 60 percent lower risk of developing prostate cancer, but their likelihood of dying from it is nearly double (66)Manfredi C, et al. (2023) Curr Oncol Rep, 25: 1431. [LINK NOT AVAILABLE]. Studies have also found that men who have sex with men (MSM) are at a higher risk of HPV–associated anal cancer than their heterosexual counterparts (67)Clifford GM, et al. (2021) Int J Cancer, 148: 38. [LINK NOT AVAILABLE]. This risk is further increased among those infected with human immunodeficiency virus (HIV): HIV-negative MSM are 20 times more likely and HIV-positive MSM are 40 times more likely to have anal cancer, compared to heterosexual men (68)Machalek DA, et al. (2012) Lancet Oncol, 13: 487. [LINK NOT AVAILABLE].
Examples discussed above highlight the urgent need for comprehensive SOGI data collection for accurate estimation of the cancer burden in the SGM populations. In recent years, constituents across the health care continuum have accelerated large-scale efforts to meet challenges posed by the absence of comprehensive health data from certain populations, including the SGM populations. One such effort is NIH’s All of Us Research Program, which was launched in 2018 and aims to recruit one million participants from diverse backgrounds for medical research, with the goal to improve health outcomes for all patients (70)All of Us Research Program Investigators, et al. (2019) N Engl J Med, 381: 668. [LINK NOT AVAILABLE]. Findings of a recent study from the program that included more than 30,000 SGM participants, making up nearly 9 percent of the overall study sample, show that cisgender sexual minority men were 15 percent more likely, and cisgender sexual minority women were 12 percent less likely, to be diagnosed with cancer compared to their cisgender heterosexual counterparts (71)Tran NK, et al. (2023) JAMA Netw Open, 6: e2324969. [LINK NOT AVAILABLE]. It is important to note that research initiatives, such as the All of Us Research Program, rely on primary data collection, whereas cancer registry data primarily come from medical records. Thus, collection of comprehensive cancer data on SGM populations, as well as additional research using such population-level data, is vital to fully understand the burden from all cancer combined, as well as from specific cancer types, in this population.
Possible reasons for cancer disparities among SGM populations are numerous, including high prevalence of certain risk factors (such as tobacco and alcohol use), higher rates of HPV and HIV infections, suboptimal uptake of cancer screening, a lack of knowledge among health care providers about SGM individuals’ health needs, and discrimination (72)Leone AG, et al. (2023) JAMA Oncol, 9: 556. [LINK NOT AVAILABLE]. For example, a 2023 survey of SGM cancer patients and survivors found that 37 percent of respondents faced discrimination in a health care setting due to their sexual orientation or gender identity (73)Fight Cancer. Survivor Views LGBTQ+ Cancer Patients & Survivors June 2023. Accessed: March 17, 2024. .
Populations Living Under Poverty
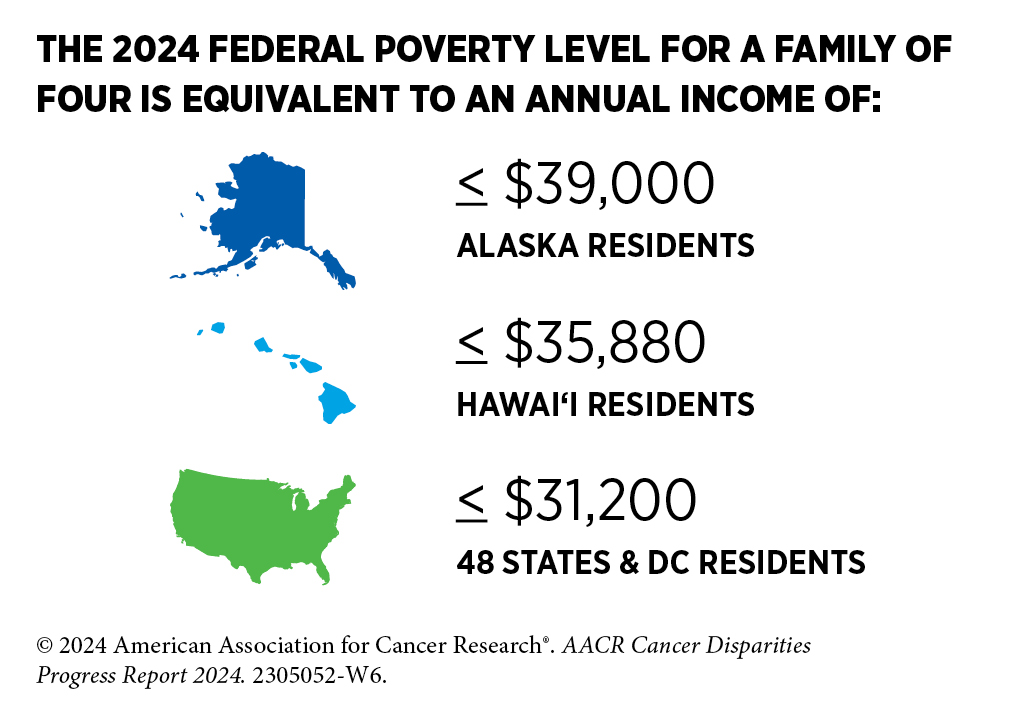
Populations who live under poverty experience a substantially disparate burden in cancer incidence, mortality, and outcomes. Areas of persistent poverty in the United States are geographic locations where 20 percent or more of the residents have lived below the federal poverty level over a 30-year period. Many of these regions emerged following racial and/or economic segregation and lack opportunities for residents to rise out of poverty, reflecting persistent disinvestment in the particular region.
According to a 2023 US Census Bureau report, Persistent Poverty in Counties and Census Tracts, about 11 percent of US counties are under persistent poverty, and most of them are in the rural Southeast (75)Census.gov. Persistent Poverty in Counties and Census Tracts. Accessed: March 17, 2024. . It is important to note that persistent poverty neighborhoods are distinct from chronic poverty, which identifies individuals and families that are living in multi-generational poverty over many years, often over their entire lives.
Researchers have found a substantially higher cancer mortality in the US counties with persistent poverty (76)Papageorge MV et al, (2023) Ann Surg, 277: 995. [LINK NOT AVAILABLE]. According to a recent study, during 2014–2018, deaths from all cancers combined were 7.1 percent higher in persistent poverty counties compared to nonpersistent poverty counties. Furthermore, compared to nonpersistent poverty counties, deaths from all major cancer types included in the study were higher in persistent poverty counties and ranged from 7.6 percent higher for lung cancer to 48.8 percent higher for cervical cancer (77)Moss JL, et al. (2022) J Natl Cancer Inst, 114: 829. [LINK NOT AVAILABLE]. Similarly, children with cancer living in persistent poverty counties in Alabama during 2000–2016 were 30 percent more likely to die within 5 years of cancer diagnosis, compared to those not living in Alabama counties with persistent poverty (78)Hoppmann AL, et al. (2023) Cancer Epidemiol Biomarkers Prev, 32: 380. .
Another study found significant differences in cancer incidence and mortality between high- and low-poverty counties—defined in the study as those above or below, respectively, the 5-year poverty rate of 14.8 percent—during 2014–2018 in Florida (79)Hall JM, et al. (2022) Prev Med Rep, 29: 101922. [LINK NOT AVAILABLE]. While low- and high-poverty counties had similar incidence rates for all cancers combined, high-poverty counties had 22 percent higher mortality from all cancers combined. Furthermore, compared to low-poverty counties, high-poverty counties had higher incidence of cancers of the cervix (52 percent higher), liver (43 percent higher), larynx (41 percent higher), stomach (27 percent higher), and lung (22 percent higher), and higher mortality from cancers of the larynx (83 percent higher), cervix (64 percent higher), stomach (45 percent higher), liver (42 percent higher), and uterus (37 percent higher) (79)Hall JM, et al. (2022) Prev Med Rep, 29: 101922. [LINK NOT AVAILABLE].
Populations living in persistent poverty areas are exposed to multifactorial structural and social drivers of health risks that contribute to a higher cancer burden. As a result, these communities comprise populations with less formal education; higher prevalence of certain cancer risk factors such as obesity, alcohol consumption, or cigarette smoking; higher exposure to environmental carcinogens; limited or no access to healthy food and/or quality health care; greater rate of unemployment; and larger proportion of racial and ethnic minority groups (75)Census.gov. Persistent Poverty in Counties and Census Tracts. Accessed: March 17, 2024. .
Achieving Health Equity: A Vital Investment for the US Public Health and Economy
Adverse effects of cancer and cancer disparities are numerous, including the economic burden placed on individuals, families, communities, and society. Examining the economic burden of cancer and cancer disparities is an important aspect for developing and implementing evidence-based strategies so that health equity can be achieved for all.
As cancer is the second leading cause of mortality in the United States, it is unsurprising that the cost of cancer care is among the highest of all diseases. According to the most recent estimates available, the patient economic burden associated with cancer care in 2019 was more than $21 billion, about 80 percent of which was out-of-pocket costs for cancer patients. For example, total out-of-pocket costs for the four most common cancers in 2019 were $3.14 billion (female breast cancer), $2.26 billion (prostate cancer), $1.15 billion (colorectal cancer), and $1.35 billion (lung cancer) (82)Yabroff KR, et al. (2021) J Natl Cancer Inst, 113: 1670. [LINK NOT AVAILABLE]. According to the most recent estimates available, cigarette smoking–associated cancers (such as lung cancer) were attributable to $20.9 billion in lost earnings in 2019 (83)Islami F, et al. (2022) Int J Cancer, 151: 2095. [LINK NOT AVAILABLE].
Medically underserved populations, including racial and ethnic minority populations, share a disproportionate economic burden associated with cancer. For example, a recent study evaluating years of life lost due to gynecologic cancer in the United States revealed that women from racially or ethnically minoritized populations had a substantially higher number of potential years of life lost compared to NH White women (84)Kaur A, et al. (2023) Gynecol Oncol, 170: 266. [LINK NOT AVAILABLE]. Similarly, another recent report evaluating cancers diagnosed in 2019 in the US found that adolescents and young adults (ages 15 to 39)—who are often uninsured or underinsured and face unique challenges after cancer diagnosis—had significantly higher lifetime costs of cancer. The study estimated that the total lifetime cost of cancer care among this population was $3.2 billion and the cost of lost productivity was $18.03 billion (85)Parsons SK, et al. (2023) J Clin Oncol, 41: 3260. [LINK NOT AVAILABLE].
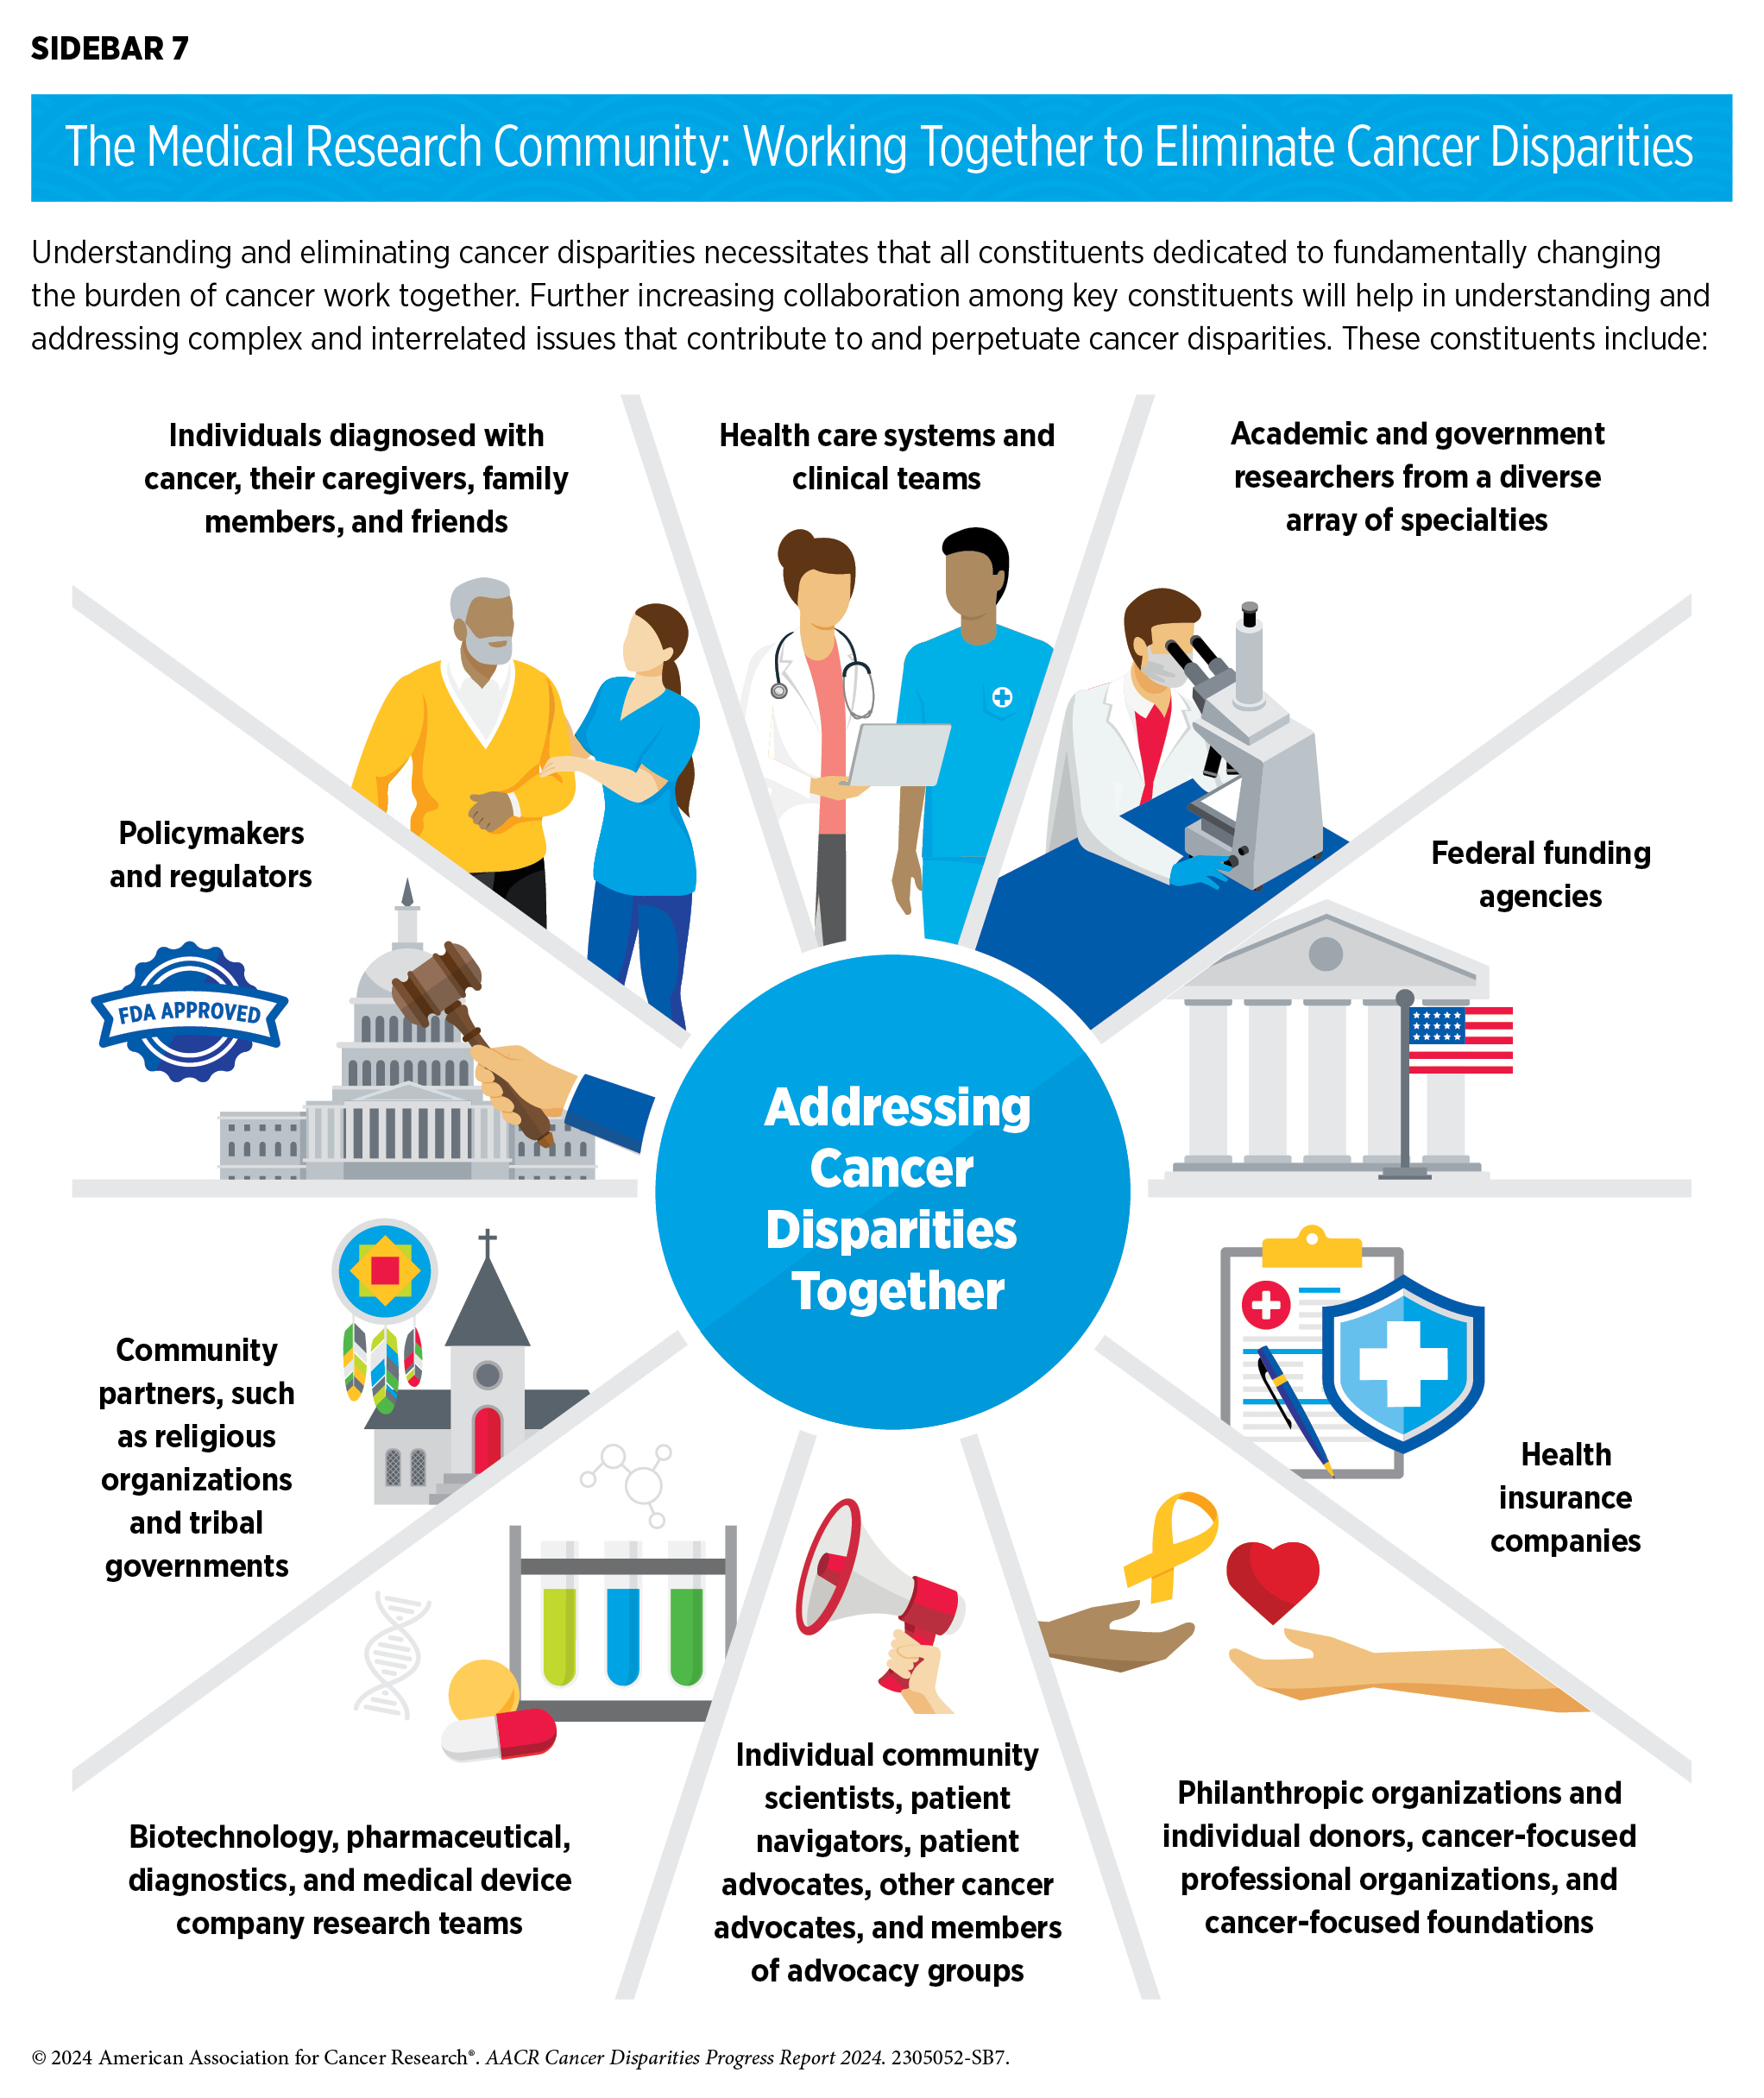
In recent years, there is increased recognition within the cancer community and the broader public health field that addressing cancer disparities is vital for achieving health equity, and constituents across the continuum of cancer care are working together to understand and address cancer disparities (see Sidebar 7). The National Institute on Minority Health and Health Disparities (NIMHD), as well as NCI and its Center to Reduce Cancer Health Disparities (CRCHD), are playing a central role in understanding the burden of cancer disparities through several programs and funding opportunities (see Overcoming Cancer Disparities Through Diversity in Cancer Training and Workforce and Sidebar 45).
Complex and multidimensional reasons drive cancer disparities and health inequities experienced by so many segments of the US population (see Understanding and Addressing Drivers of Cancer Disparities). Consequently, multipronged approaches are required to eliminate them. The bold vision of health equity can only be realized if the US Congress continues to provide sustained, robust, and predictable increases in funding for the federal agencies that are spearheading efforts to address and eliminate cancer disparities (see AACR Call to Action).
Next Section: Understanding and Addressing Drivers of Cancer Disparities Previous Section: A Snapshot of US Cancer Disparities in 2024